For anyone debugging a program, a scope can be an extremely efficient tool for determining the cause of an issue. A scope allows you to monitor a variable (or multiple) in real time, which is a great way of viewing and debugging specific parts of the machine process.
In Beckhoff, TwinCAT 3 offers a very straightforward built-in scope. In this article, I'll detail how to set up a scope to debug a program. Like TwinCAT 3, the TwinCAT 3 Scope is integrated into Microsoft Visual Studio. This integration means that you can efficiently switch between programming work and feedback monitoring within the same solution.
1. Adding a scope
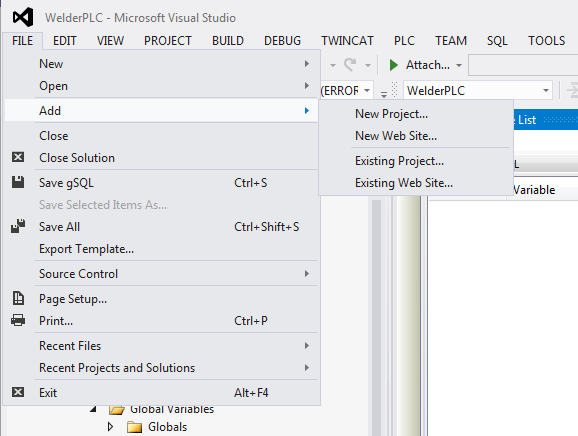
File > Add > New Project
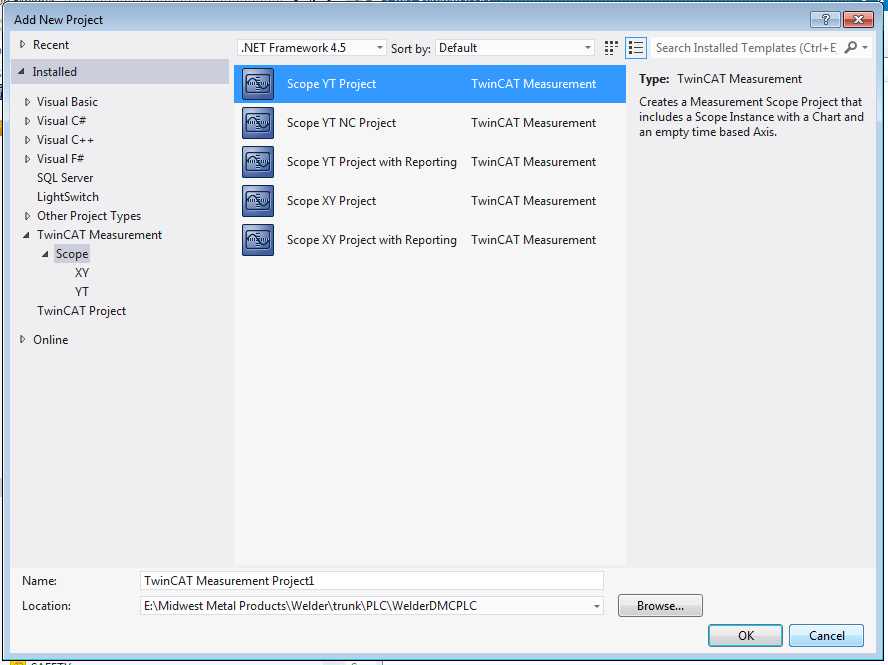
The next step is to select the desired scope. In this example, I’m going to be using a Scope YT Project, which will allow me to scope different project variables against time.
TwinCAT Measurement > Scope > Select the desired scope
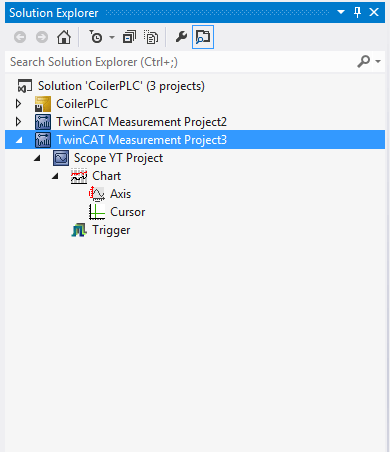
In your solution explorer, you’ll see that a TwinCAT Measurement Project has been added. Within this dropdown, we see the scope project, a chart, an axis, a cursor, and a trigger. For this tutorial, I’m going to focus on a single chart with different axes.
2. Adding Variables
Adding variables is extremely easy! Each variable is considered to be a “channel”. To add one, right click the axis to which you want to add a channel, and select “add channel”.
3. Variable Setup
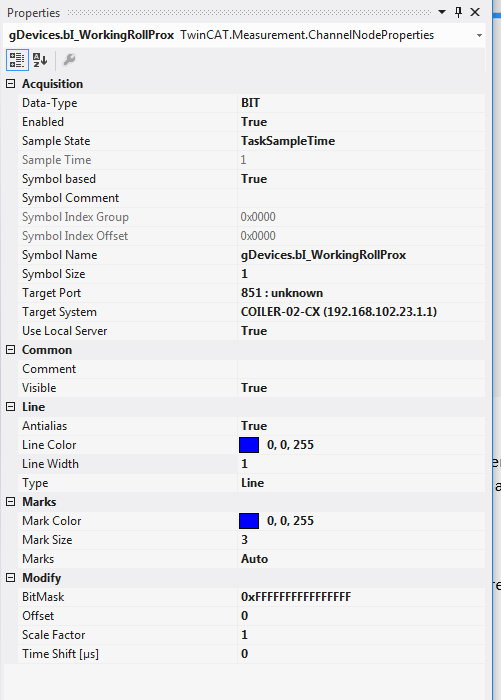
So now that you have your channel in your axis, what else do you need to set up? The last piece of the puzzle is the properties page. Right click on your newly created channel, and select properties (or hit Alt+Enter).
The key elements to fill in are the data type, enabled Boolean, symbol name, and target system.
| |
|
|
|
Data Type
The data type will simply be the data type of the variable you’re using.
Enabled
The enabled field should be true, assuming you’d like to scope this variable. If you decide you want to hide certain variables from your scope, this can be set to false.
Symbol Name
The symbol name is the name of the variable as you’d use it in your program. In this case, I have a variable called bI_WorkingRollProx that is contained in a gDevices data structure.
Target System
Finally, the target system will be the AMSNetId of the system to which you’re connecting.
|
|
 |
With this all set up, you’re ready to scope! However, if you want to set up your axis, it’s as simple as right clicking your axis and selecting properties (or, again, Alt+Enter).
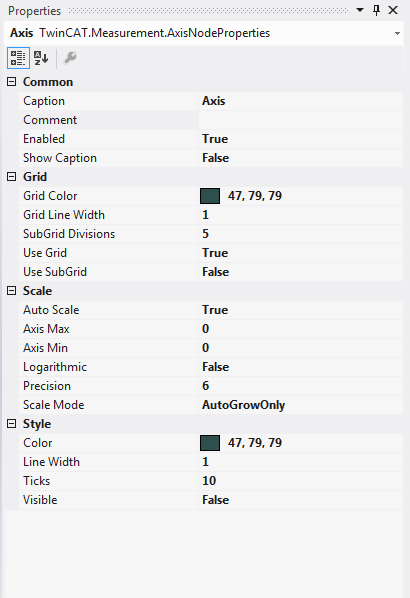
From here, you can edit your axis max/min, set up grid settings, or set the axis to auto scale. Auto scale will dynamically adjust your view of the axis as the variable is being monitored. This can be a really clean way of viewing your data without ending up overly zoomed in or out.
If you have additional variables to monitor, you can always add another variable to your scope. If your new variable has a different axis reference, another axis can be added to the chart, and then the variable can be dragged and dropped into the new axis.
4. Scoping!
To start the scope process, you’ll need to hit the record button (F5).

Once you’re done recording, hit the stop record button (F6). From the resultant graph, you can zoom in and out on any part of the graph, as well as hide different variables that may no longer be relevant.
Below, you’ll see that I’m scoping three variables on three different axes. In this case, I’m using several factors to determine the length of a piece of material moving through a machine. You’ll notice the stick length (green line) increasing as the material is being processed, then the length steady out as the material is finished.
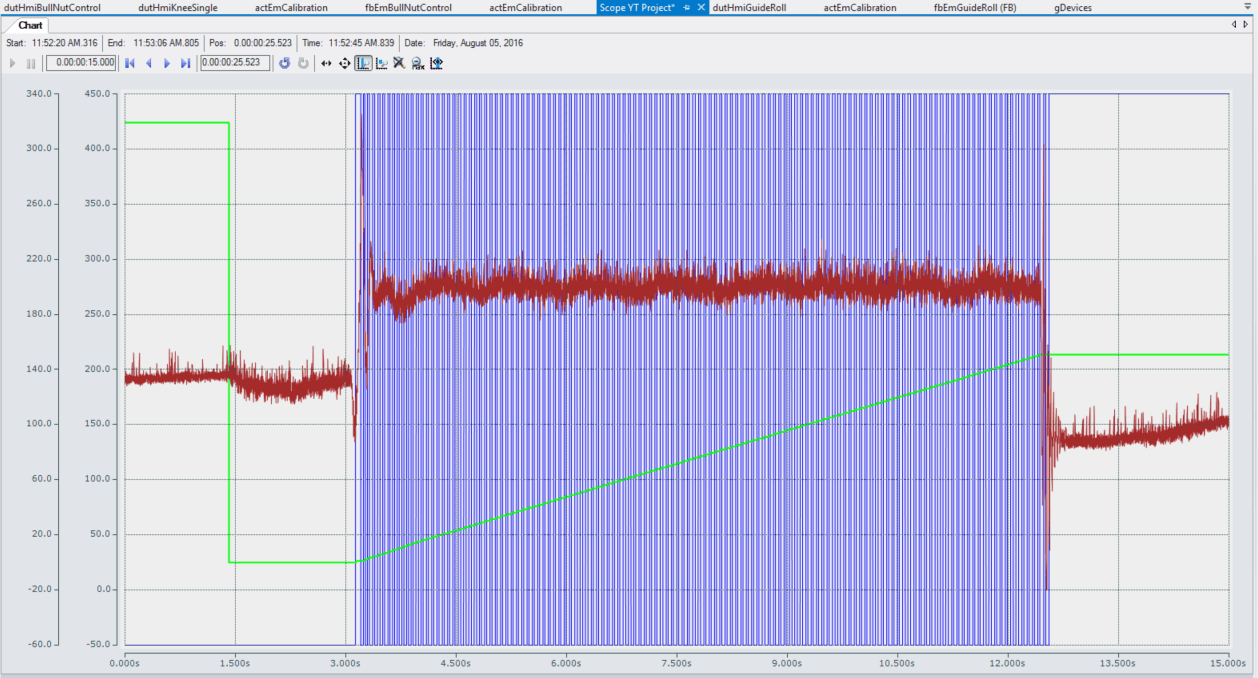
With your final real-time display, it is significantly easier to monitor processes that may be happening in your PLC, or processes that are happening too quickly to view. Overall, with the built-in scope tools TwinCat 3 offers, it is extremely straightforward to monitor several changing variables and easily debug systems.
Learn more about DMC's Beckhoff and TwinCAT 3 programming expertise.