When using Telerik to graph in .NET, there are some tips and tricks to remember.
Refer to Using Telerik to Create Multi-Series Plots in .NET for the basis of this blog.
Populate Your Chart with Data – Series Provider
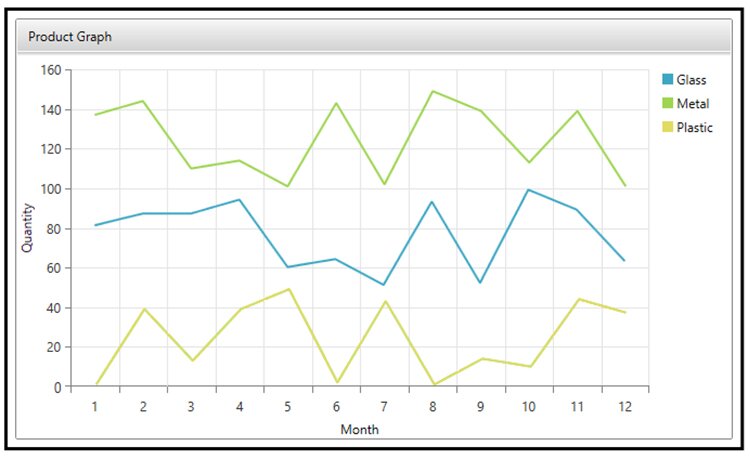
In Using Telerik To Create Multi-Series Plots in .NET, you saw an example of how to add data to a chart using a series. This was easy to do, but included a lot of repetition if you needed multiple items to be plotted. To make this easier and more extensible, we can use a Series Provider.
As you can see below, from the users perspective, a chart created using a series vs. a series provider looks the same, but the series provider makes it easier for you, the programmer.
For this example, we have created a collection of Product data. Product includes the name of an item and a Collection of ProductSales data.
You must specify a Chart Series Provider source, which will be your Product collection.
Make sure to specify the following items:
- ItemsSourcePath which is the name of the collection you would like to graph
- The Target Type (Line Series, Bar Series, etc.)
- The Legend Settings
<telerik:RadCartesianChart.SeriesProvider>
	<telerik:ChartSeriesProvider Source="{Binding TestFullCollection}">
		<telerik:ChartSeriesProvider.SeriesDescriptors>

			<telerik:CategoricalSeriesDescriptor ItemsSourcePath="Sales" ValuePath="Quantity" CategoryPath="Month">
				<telerik:CategoricalSeriesDescriptor.Style>
					<Style TargetType="telerik:LineSeries">
						<Setter Property="StrokeThickness" Value="2"/>
						<Setter Property="LegendSettings" Value="{Binding Name, Converter={StaticResource StringToLegendSettingConverter}}"/>
					</Style>
				</telerik:CategoricalSeriesDescriptor.Style>
			</telerik:CategoricalSeriesDescriptor>

		</telerik:ChartSeriesProvider.SeriesDescriptors>
	</telerik:ChartSeriesProvider>
</telerik:RadCartesianChart.SeriesProvider>
Setting the legend is a bit more complex and will require the use of a converter, which will be described in the next section.
Legend Converter
The Value for a legend must be of type SeriesLegendSetting and cannot be of type string, therefore you will likely need to use a converter.
Below is an example of the converter that we used to get the legend to the proper data type. We did not feel the need to populate the ConvertBack method.
public class StringToLegendSettingConverter : IValueConverter
    {
        public object Convert(object value, Type targetType, object parameter, CultureInfo culture)
        {
            if (value is string)
            {
                return new SeriesLegendSettings() {Title = value.ToString()};
            }
            return "oops!";
        }

        public object ConvertBack(object value, Type targetType, object parameter, CultureInfo culture)
        {
            throw new NotImplementedException();
        }
    }
Unique Formatting with a Series Provider
A big benefit of using a Series Provider is the ability to plot many sets of data with a single binding instead of one binding for each item you would like to plot.
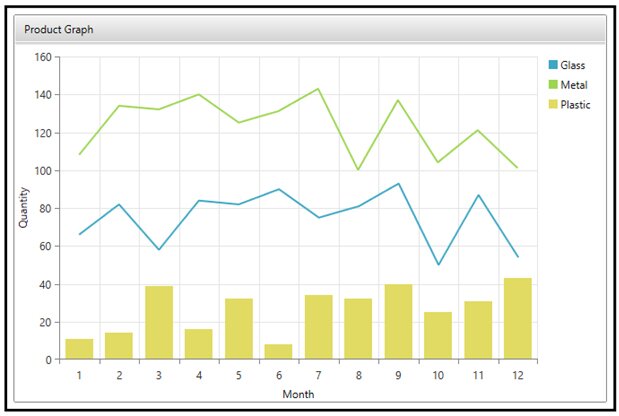
But, what if you want one item to be a Bar Series instead of a Line Series? That is possible!
This snippet below shows how to specify exceptions within your series provider and customize the series properties.
<telerik:CategoricalSeriesDescriptor ItemsSourcePath="Sales" ValuePath="Quantity" CategoryPath="Month" CollectionIndex="0">
	<telerik:CategoricalSeriesDescriptor.Style>
		<Style TargetType="telerik:BarSeries">
			<Setter Property="LegendSettings" Value="{Binding Name, Converter={StaticResource StringToLegendSettingConverter}}"/>
		</Style>
	</telerik:CategoricalSeriesDescriptor.Style>
</telerik:CategoricalSeriesDescriptor>
The major addition to allow for this is specifying the CollectionIndex for the item you would like to display differently. Then, you just have to change your target type from “telerik:LineSeries” to “telerik:BarSeries”.
Rotating Axis Items
Fortunately, there is a very simple fix if you axis item labels are too long.
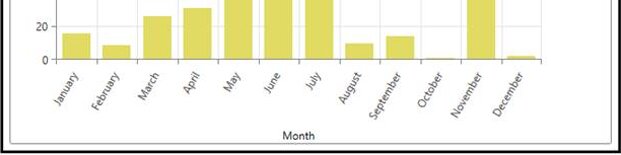
Simply add LabelFitMode=”Rotate” to the declaration of the Axis you want to modify.
<telerik:RadCartesianChart.HorizontalAxis>
	<telerik:CategoricalAxis Title="Month"
							 LabelFitMode="Rotate"/>
</telerik:RadCartesianChart.HorizontalAxis>
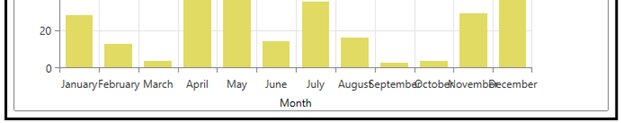
Vs.
Full Code
Conclusion
These tips and tricks should help you improve the display of your graphs in Telerik. If you're looking for assistance on a project, we can help you take advantage of Telerik UI for WPF for data management, data visualization, and much more.
For additional information, check out DMC's .NET Application Development services.