The project consisted of three parts: unsupervised learning, supervised learning, and the creation of a telemetry analytics dashboard. The system was developed using Python and Jupyter.
Part 1: Unsupervised Learning - Pattern Search
DMC preprocessed the data using K-Nearest Neighbor's (KNN) imputation, feature scaling, normalization, and Principal Component Analysis (PCA). DMC then created clustering models to discover the underlying pattern in the raw data and decoded the pattern to produce meaningful data. Later, evaluation matrices (Silhouette Score and Davies Bouldin Score) and cluster visualization techniques (T-Distributed Stochastic Neighbor Embedding and Principal Component Analysis) were applied to evaluate the results.
Oil wells that differed in condition (location, depth, equipment, etc.) had different telemetry performances. By clustering the well condition data, we could identify if there were similarities between certain well conditions and if clusters were substantially different from each other. Analyzing the corresponding telemetry performance of the clusters guided us to set up wells with better telemetry performance.
Part 2: Supervised Learning - Diagnosis and Prediction
After Phase I (Unsupervised Learning), DMC created a more powerful machine learning model capable of diagnosing well conditions and providing guidance on ways to optimize telemetry performance. We designed the model to predict telemetry performance for newly-acquired sets of well condition data.
To train supervised learning models, the prediction goal (telemetry performance) must match up with the inputs (well conditions). The raw telemetry performance data consists of time traces, so to prepare the training data, DMC extracted features from the time traces and paired them up with corresponding well condition data using Dataiku.
With the training data well prepared, DMC preprocessed the dataset using one-hot encoding, imputation on the missing values, and feature scaling. DMC then trained non-parametric models (K-Nearest Neighbors and Decision Tree Regression) and parametric models (Lasso regression, Kernel Ridge Regression) as baselines. Finally, a Deep Neural Network was developed to perform the diagnosis and prediction tasks.
In order to use the neural network to improve telemetry performance, DMC designed feature importance analysis methods targeting specific diagnostics. DMC used several statistical approaches to identify numeric and categorical features, then ranked the conditions of a well to optimize telemetry performance.
Part 3: Telemetry Analytics Dashboard - Visualization
The telemetry analytics web interface was designed using Plotly for the purpose of visualizing the massive dataset, running statistical analysis, and displaying the resulting graphs. The dashboard provided a tool for the client to easily visualize the data and obtain information without being exposed to implementation details.
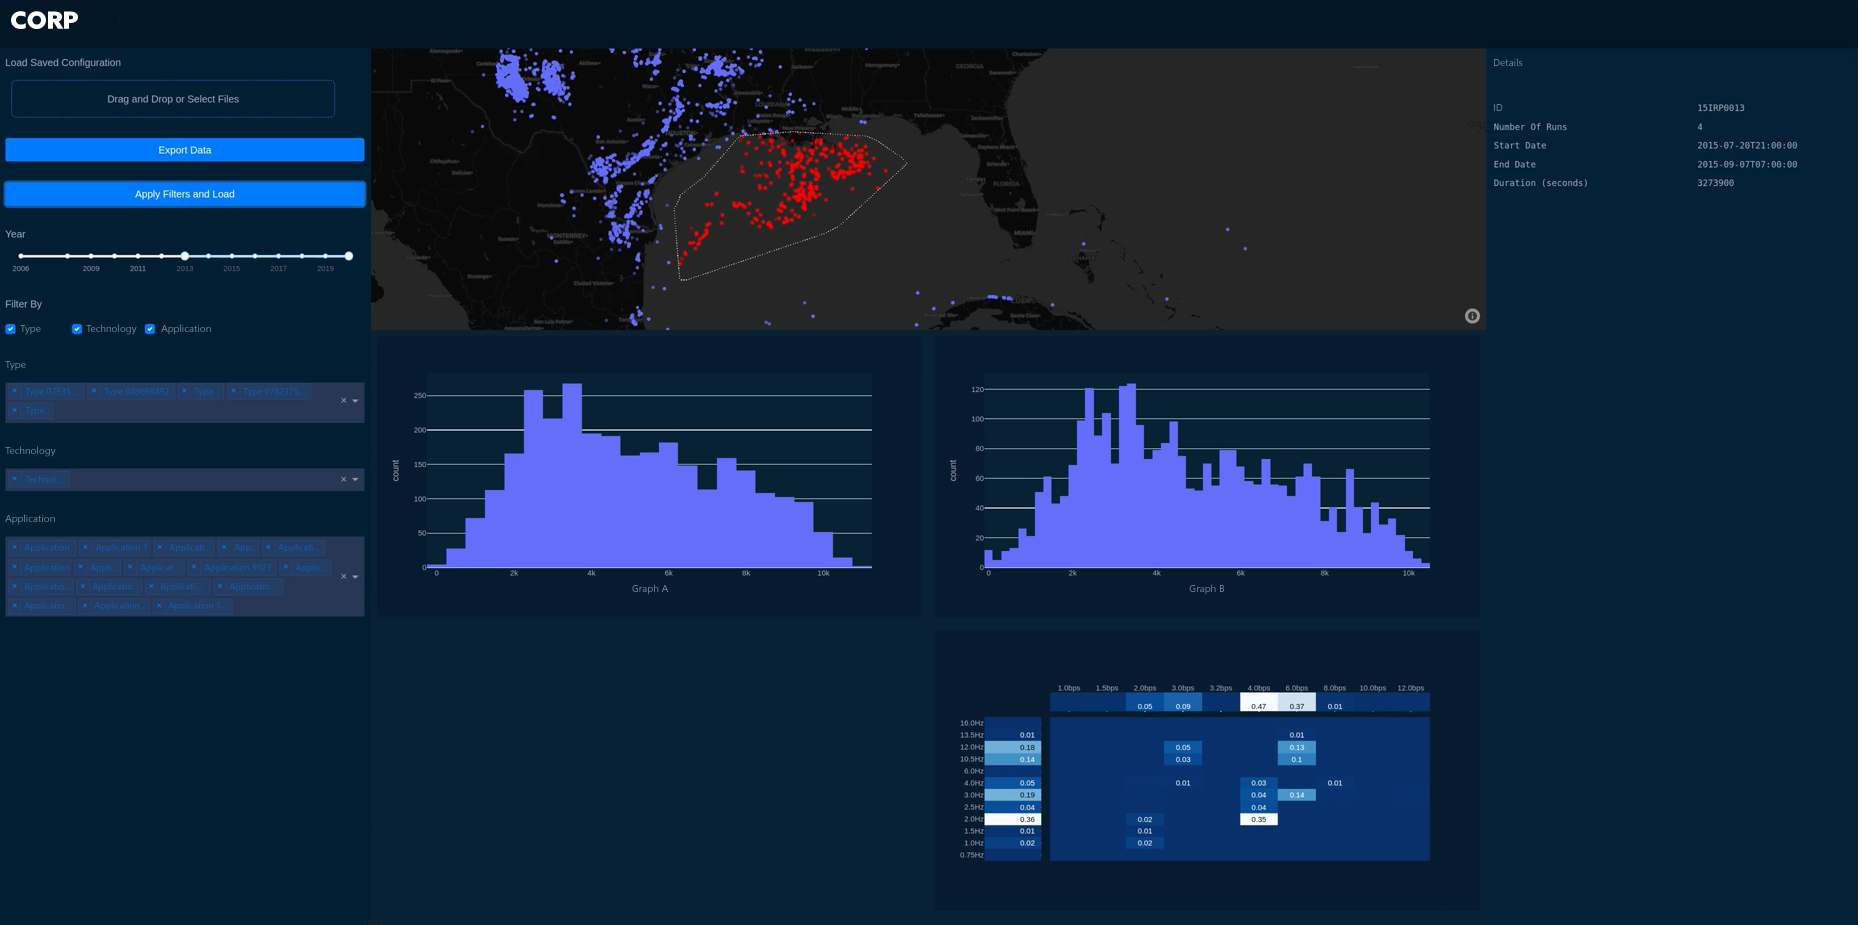
The dashboard displayed the oil wells on a map based on their recorded geographic locations, allowing users to click on a well location to reveal detailed information about the well. Users could select multiple wells on the map or use filters to select wells meeting certain criteria. Based on the selected data, the dashboard can run statistical analyses and display a variety of visualizations (heat maps, word clouds, histograms). Users can also export selected data and graphs and save filter configurations for later use.
Learn more about DMC's Test and Measurement expertise and contact us for your next project.