WinCC Unified is a powerful HMI (Human Machine Interface) system for a wide range of applications. Unified is powerful and flexible, in part due to its event-based scripting. These JavaScript scripts can be set to execute from a wide range of events, from a button press to value updates or the display of a new screen. One helpful tool when writing these scripts is DevTools, a built-in debugger in Chrome.
Getting Set Up
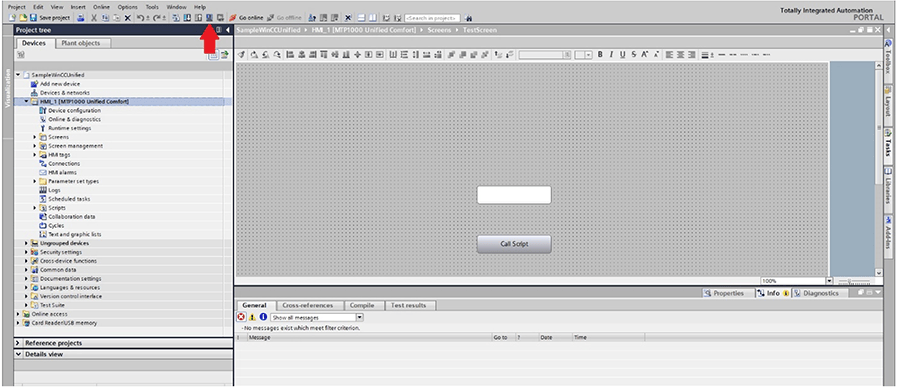
First, start a simulation of your HMI by pressing the “Start Simulation” button on the top of the screen.
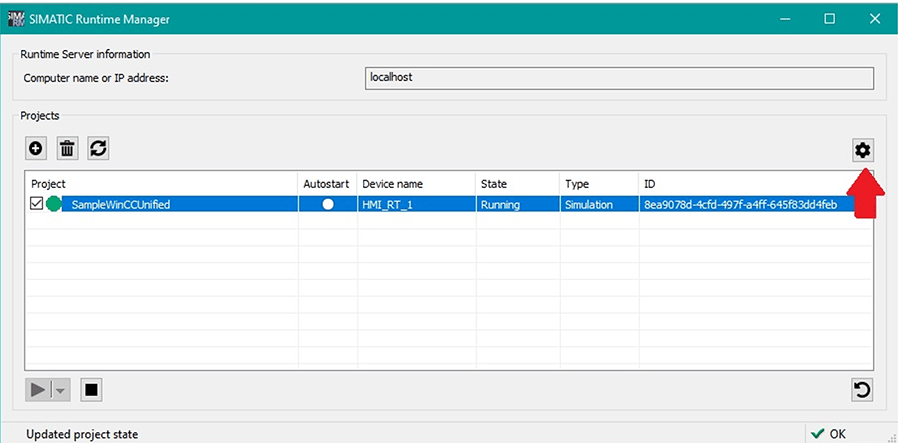
Second, open the SIMATIC Runtime Manager application and enable the debugger.
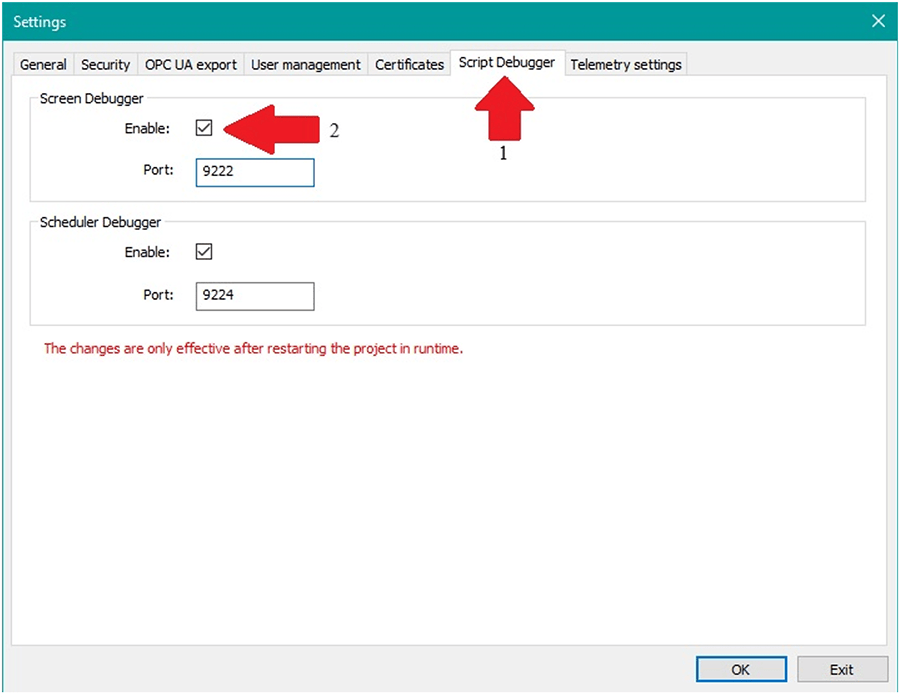
The project runtime must be restarted for these changes to take effect. Once that is done, everything should be set up to start debugging!
Opening the Debugger
Open the simulation in your web browser by going to <https://<PC_Name>. The name of a PC can be found by going into Settings > System > about and looking under ‘device name.’ From here, click on WinCC Unified RT and login using the user created in TIA Portal under security settings. Make sure this user has the HMI Administrator and Operator roles assigned.
Now, open the debugger by going to chrome://inspect. Make sure to do this in Google Chrome with version 80 or higher. Open the ‘configure’ pop-up and enter the IP address and port set to the simulation, for example, localhost:9222. The port number can be found in the SIMATIC Runtime Manager under settings > Script Debugger > Screen Debugger port. Once this is set, hit done and then refresh. After a few moments, the project should populate.
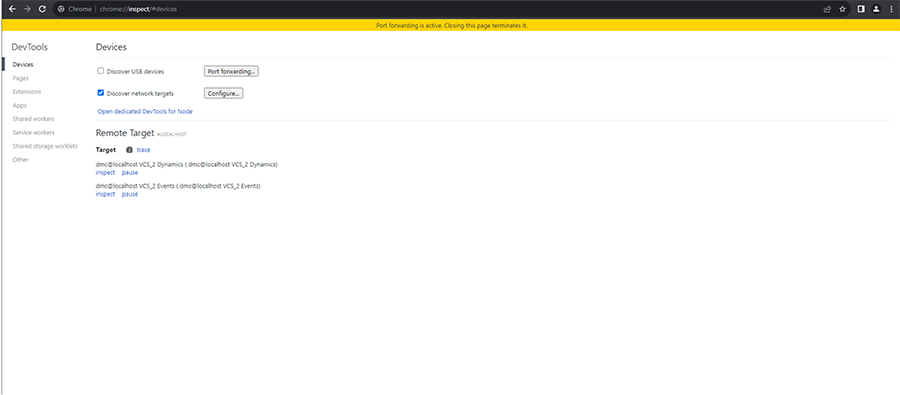
Click on the second “Inspect” link under the “Events” tab. DevTools should open. Make sure the “Sources” tab on the top ribbon is selected, and the scripts for the current screen should populate.
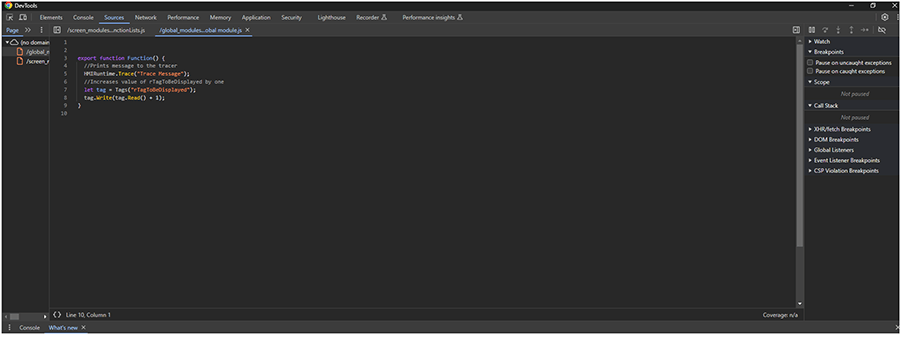
Using the Debugger
This debugger functions as expected. Clicking a line number on the left of the text adds a breakpoint, allowing the program to be stepped through line by line after the breakpoint is triggered.

Clicking the button that calls the relevant scripts causes the code to stop at the breakpoint.

Now, if we step over the line, we can see it executed that line and stopped on the next.

Checking the Trace viewer should now display the message “Trace Message,” as that line has been executed.

If we press the resume script button shown below, the rest of the script will execute as no other breakpoints are present.

As shown below, the code is not stopped anywhere, and the tag value has increased by one.

While stepping through code, it is also possible to view current values underneath the scope drop-down on the right-hand side. Here you can view local, module, and global values from their corresponding sections.
Things to Know
- The debugger is only active for the current screen displayed. No other scripts can be viewed, and opening a different screen may require the debugger to close and reopen.
- Any changes made to the code in the debugger are NOT saved to the project. For this reason, it is best to edit code directly from the TIA portal.
- Lastly, refreshing the simulation will cause DevTools to disconnect; often, the only way to reconnect after this is to close and reopen the debugger.
DMC is recognized as a Siemens WinCC Specialist. Learn more about our WinCC expertise and contact us for your next project.


