DMC improved the client’s thermal lab by adding a multi-channel temperature and humidity logging testing station. DMC designed and implemented a table-top data acquisition system that would allow the client to gather and view data from over one hundred sensors during multi-day testing.
The system needed to be portable, yet reliable, so the client could move the hardware from lab-to-lab while maintaining confidence that data would be consistent over the course of longer tests.
The data acquisition system consisted of two key subsystems: a test executive application written in LabVIEW, and an NI CompactRIO (cRIO) with Digital IO modules, purpose-built PCB adapters, and Sensirion temperature and humidity sensors.
The sensors were attached to the Unit Under Test (UUT) and then cabled to the PCB adapters of the data acquisition system. The PCB adapters provided power to each of the sensors and routed the data signals to and from the IO modules in the cRIO chassis. DMC programmed the FPGA on the cRIO such that it would acquire data from the Sensirion sensors reliably and with consistent timing.
The test executive application ran on a Windows PC and communicated with the cRIO to receive the data from the sensors.
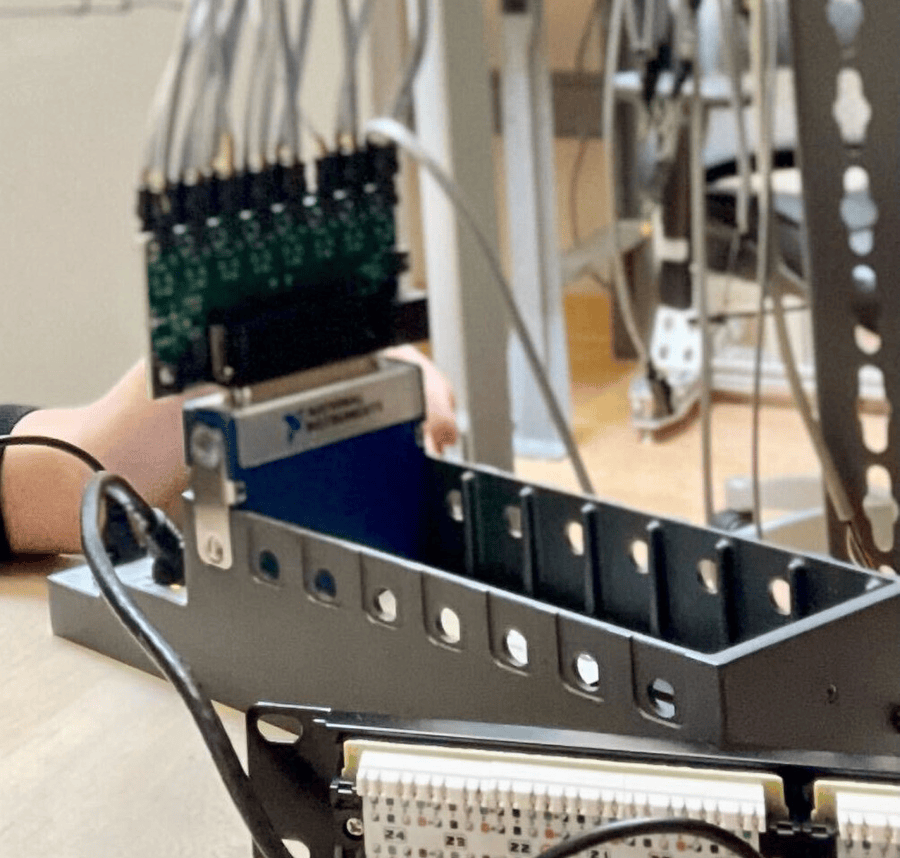
Part of the system during development with sensor cables plugged into an NI module
Hardware Design
The following components were core pieces of the system's hardware:
- An NI compact RIO (cRIO) chassis with an FPGA and several digital input modules
- Sensirion temperature and humidity sensors
- Purpose-built PCBs to route power and data signals to the sensors
- Din-rail mounted power supplies for portability
- Rack-mount PC
- Miniature server rack or pelican case for portability
The sensors communicated over the I²C protocol. DMC programmed the FPGA on the cRIO to parse the digital IO from the modules and get sensor data back to the PC application. The custom PCBs were used to route this sensor data to the appropriate digital inputs.
DMC architected the system with easily replaceable, modular components. The system can run with any number of the modules connected, and, if one were to fail, they can be swapped out without requiring a system overhaul.
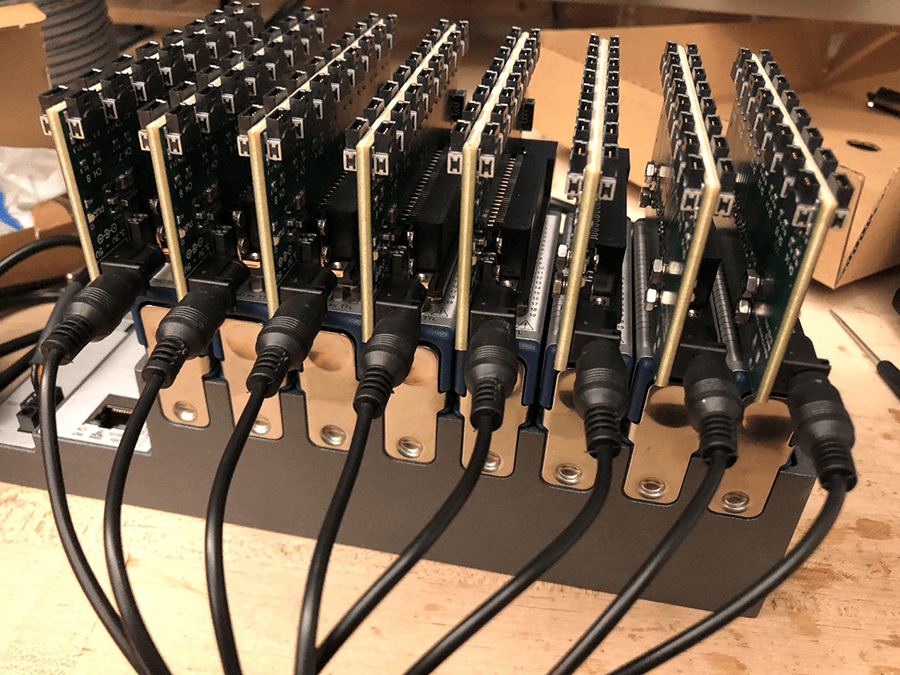
The cRIO chassis fully populated with module and PCBs
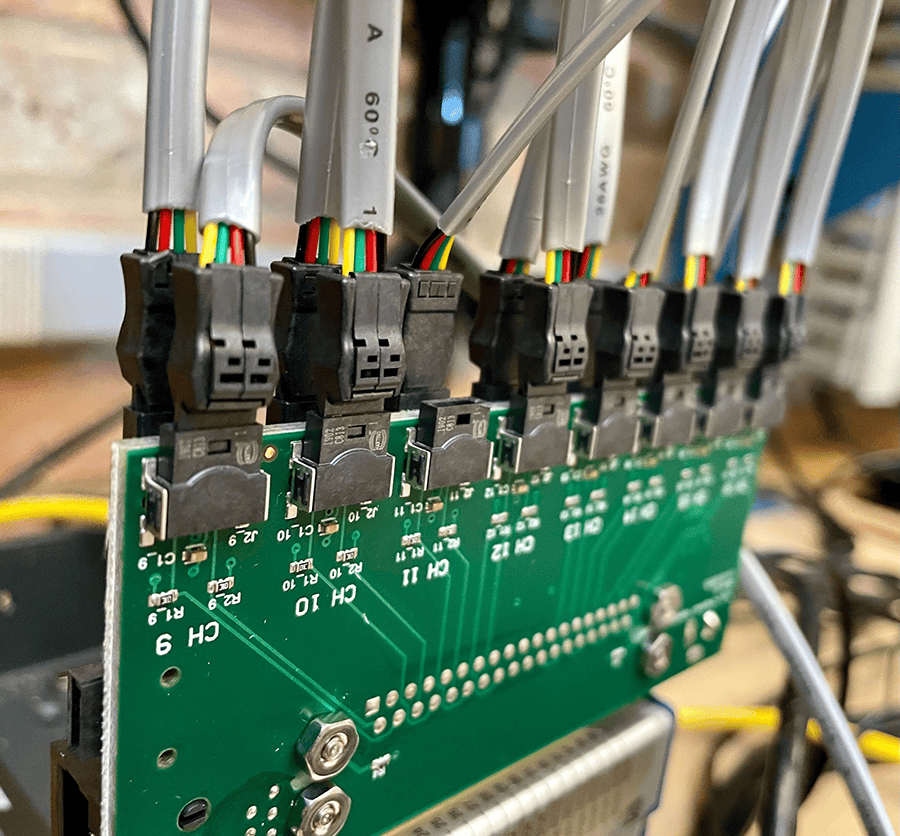
One of the custom PCBs with sensor cables populated
User Interface and Experience
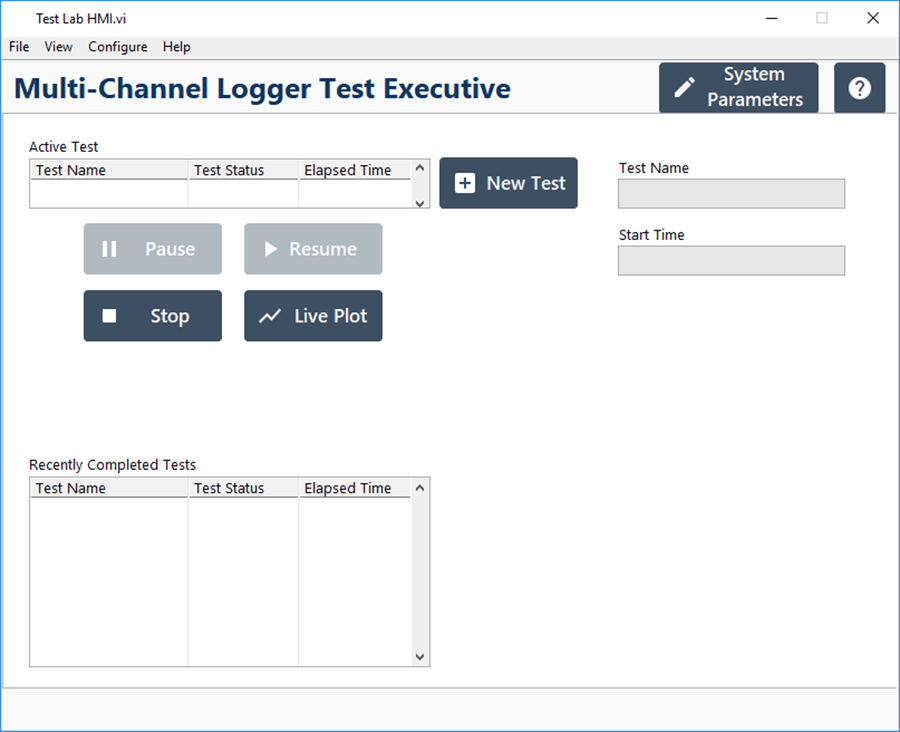
The Main User Interface
The main user interface allowed for easy configuration of both a test and a summary of completed tests, and it contained options to control any current tests and pop-out live plotting. A “System Parameters” window also allowed the user to configure important persistent information, such as hardware references and log file directories, without requiring code changes in the future.
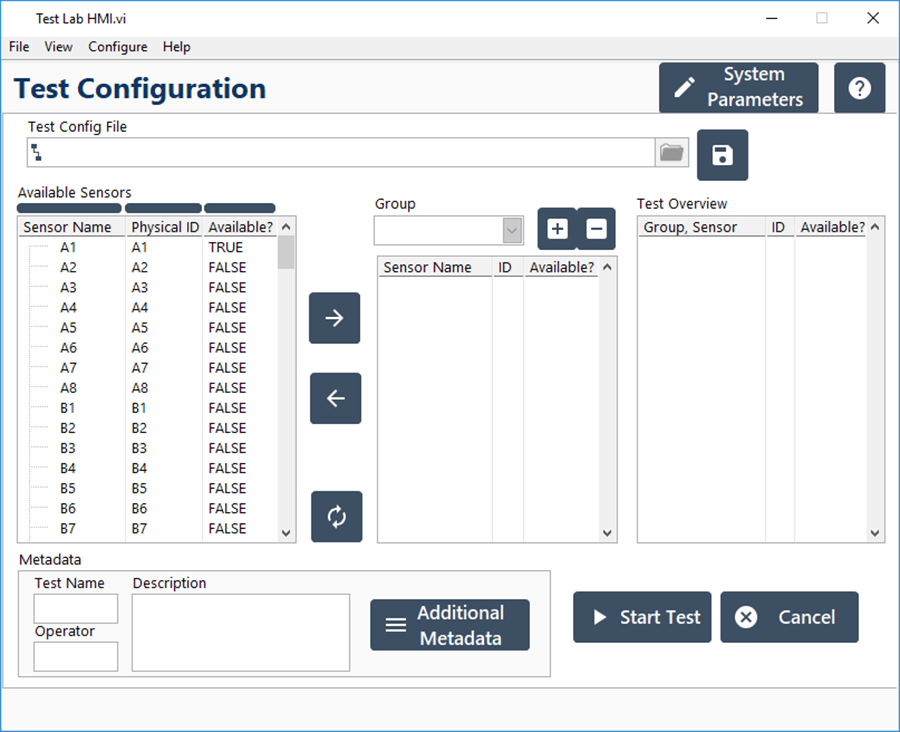
The Test Configuration screen
Test configuration allowed the user to save and load test configurations from a file for reuse. Additionally, DMC designed the software to allow user-customizable sensor groups, as well as any type of metadata desired in addition to the required Operator and Test Name. These elements of flexibility allowed the user to modify their experience for different UUTs or test report requirements without having to go into the source code or have major revisions.
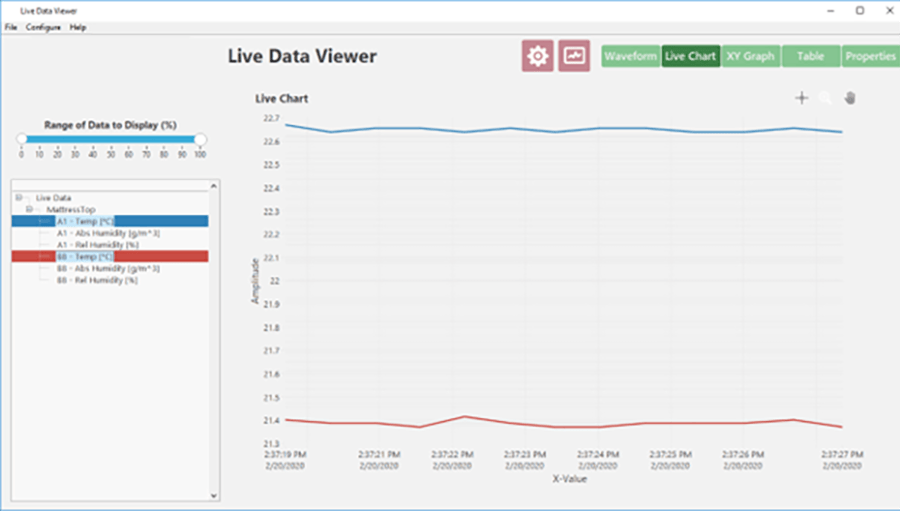
Live Plotting
Once a test is running, data can be viewed live with a customized, embedded version of DMC’s SuperViewer. The SuperViewer allows the user to view data channels live, as well as after the test once it is logged to TDMS files.
In addition to the live plotter, the software could also display a live intensity map for temperature and humidity to build a profile of the UUT, with configurable analysis parameters.
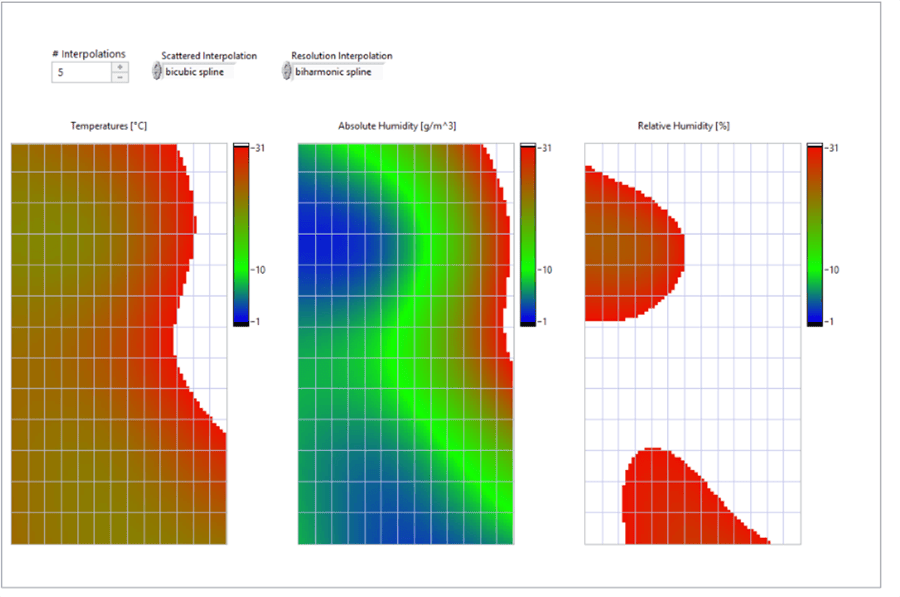
Intensity map interpretation of the data
Results
Our client is actively using DMC’s custom solution and has worked with DMC to build even more features into the software, such as sensor calibration and more detailed live plotting. There are multiple units of the turnkey system in their labs across the globe, and we look forward to continuing to build out their testing capabilities.
Learn more about DMC’s LabVIEW Programming and contact us for your next project.