In my years of LabVIEW development at DMC, I’ve often found that I could be more efficient and develop better software by using LabVIEW and C# in tandem as opposed to LabVIEW alone. In certain circumstances, it can save time (and therefore budget) and reduce complexity when trying to tie together multiple systems. You also get easier access to the low-level features of Windows by using Microsoft’s own ecosystem, unlocking functionality that isn’t natively available in LabVIEW.
Driver Integration
If you have ever integrated any kind of device into a LabVIEW application, chances are you looked for a LabVIEW driver, perhaps through the NI Tools Network. Many instrument vendors provide a LabVIEW driver for their device, but some do not. In these cases, drivers may instead be provided for Python or C#.
If the device doesn’t have a provided LabVIEW driver, you aren’t out of luck! Whether it’s Python or C#, you can still use that driver to integrate the device with your LabVIEW software (though this blog will focus only on C#).
Reuse Code
If your company has multiple projects and uses multiple programming languages, it can be helpful to reuse code between projects. Reuse code improves efficiency and consistency, reduces the amount of time you spend making updates to systems, and makes it easier to train up and onboard new engineers onto your team. Developing core functionality in C# allows both .NET developers and LabVIEW developers to take advantage of it.
Library Compatibility
LabVIEW has a lot of functionality, but there’s always that functionality that pops up that you know is available in another package, but you just can’t find a LabVIEW version. For example:
- JSON serialization
- Database interaction
- Calls to web services
- Interaction with Windows features (e.g., Active Directory)
- Cryptographic utilities
Best Practices for Using C# DLLs in LabVIEW
Storing Source Code and DLLs
DMC always recommends keeping your source code in source control such as GitLab. Source control enables you to track changes that have been made over time and improve overall project quality. You can also configure GitLab or GitHub to build your library automatically when changes are made and to store the output. This way, you don’t need to worry about different developers’ build environments, and you have a common storage location for the output. This practice is called Continuous Integration/Continuous Deployment, or CI/CD.
If you’re using CI/CD, the best practice for storing built code is to store it as an artifact from your CI/CD pipeline in the source control system rather than committed to the repository. If the artifact is ever deleted, you can manually trigger a rebuild in most systems to rebuild. For more information on CI/CD pipelines, check out this DMC article by Gabby: Intro to CI/CD Pipelines.
If you are using a library written in C#, C, or C++ and you are not building using CI/CD, I recommend keeping the DLL file somewhere in your class hierarchy near the VIs using it. For example, if you have a set of VIs for reading from a device that will use this DLL, place the DLL in the same folder as the VIs. Alternatively, place all of the DLLs together at the root of your project. This ensures that anyone copying or backing up the code will have the libraries in the correct location.
For more information on the benefits of CI/CD, check out this article on quality from Chris: ADG Mission Critical Applications: Quality Matters.
Versioning and Metadata
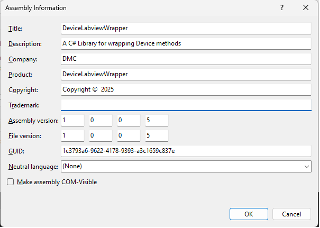
If, in the process of troubleshooting or upgrading a system, you need to edit your custom DLL, you should use C#’s version control features to help you and LabVIEW keep track of what version is being used in the code. You can set the version and the metadata for the DLL using the Assembly Information menu in Visual Studio.
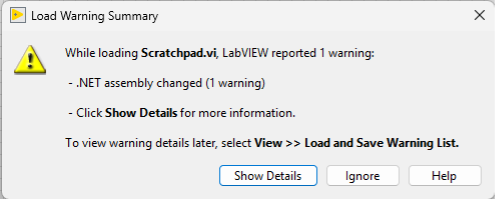
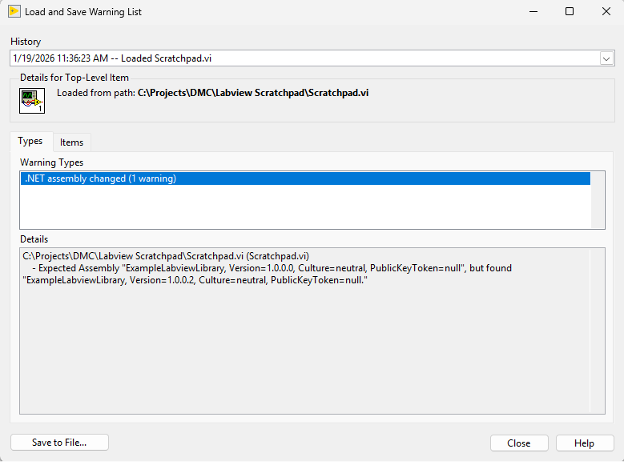
When you replace the DLL in your code by deleting the old DLL and copying the new one in, you will get a warning pop-up notifying you that the LabVIEW code is pointed at a new DLL version. If you intended this change, this is a helpful reassurance that your change was found. This is also good to know if you’re opening a LabVIEW project and you aren’t sure that the version of the DLL your code is using matches the version last used in the LabVIEW project. If the DLL versions are unexpectedly different, that can indicate that you need to verify the DLL’s usage for any changes.
Use LabVIEW-Friendly Types
Not all C# types are easily usable in LabVIEW. Many are accessed in LabVIEW as .NET references, rather than native types that you’re used to in LabVIEW. One example that comes up frequently is Lists vs Arrays. In C# development, Lists are used frequently to store multiple items. However, if you try to use a List as an input or output from a C# method in LabVIEW, you’ll need to put in a lot of property nodes to get the data you actually want.
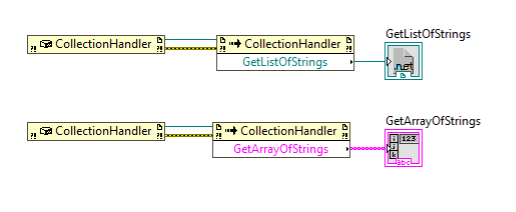
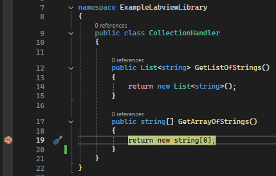
In the following example, I have a simple class that returns either an Array or a List of strings.
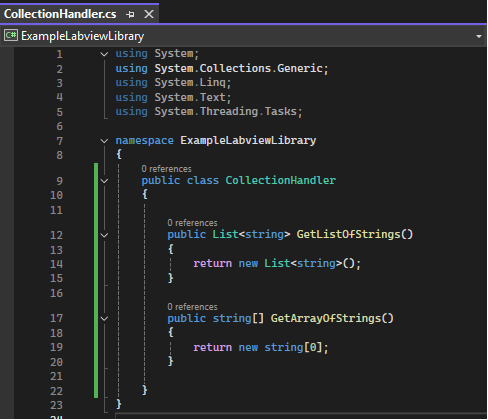
When I use that class in LabVIEW, the Array comes through as a LabVIEW Array of strings, which will be easy to handle natively! The List, however, comes in as a .NET object reference. It is possible to use but it will be more difficult and messier.
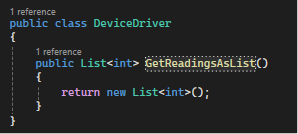
If you are integrating a C# DLL that uses LabVIEW-unfriendly .NET types like List, you can create a wrapper DLL that translates the difficult-to-use elements into natively supported LabVIEW types. Continuing the List and Array example, if my Device Driver provides its readings as a List.
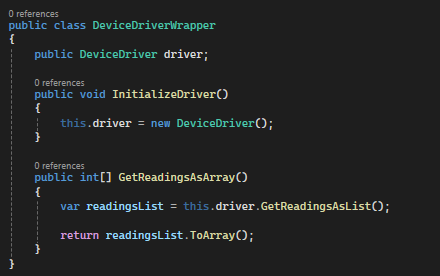
I can create a wrapper class for the driver that will convert the readings from a List to an Array. Now I can more easily call my wrapper in LabVIEW instead of the original driver.
Troubleshooting
If the C# DLL doesn’t work immediately, you’ll need to do some troubleshooting. The following tips can be helpful for troubleshooting the interaction between the DLL and LabVIEW.
Debugging DLL Calls Made in LabVIEW
The best way to troubleshoot is to see how your DLL behaves when it receives data from LabVIEW. To do this, it can be helpful to configure the Visual Studio debugger so that you can hit breakpoints in your C# code when the library is called from LabVIEW. Note: for this process, you will need to be using a DLL built in the debug configuration.
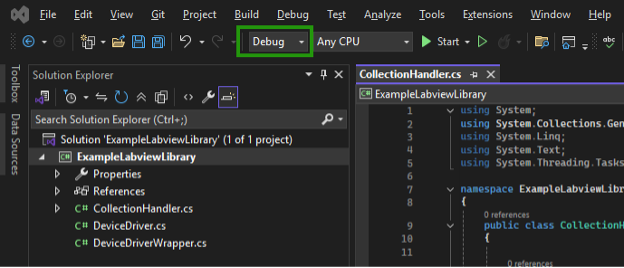
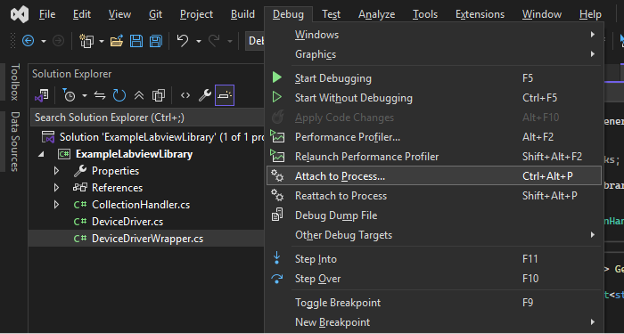
In Visual Studio, select Debug > Attach Process.
In the Attach to Process pop-up, select LabVIEW from the list. Click Attach.
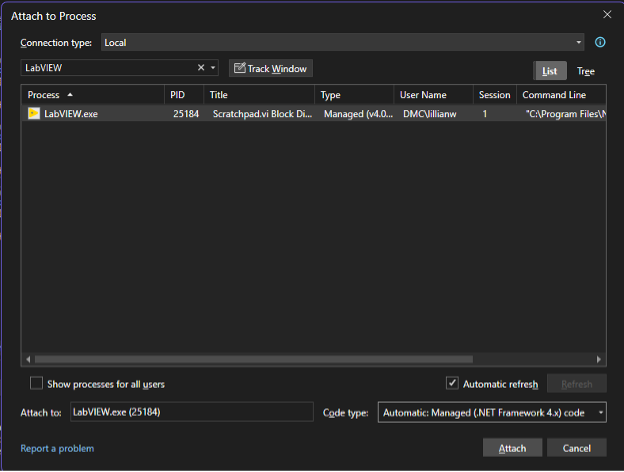
Place breakpoints in your C# code as needed. When you’re ready to debug, open LabVIEW first, then run the Visual Studio debugger (after the first configuration described above, you can run the debugger again by selecting Debug > Reattach to LabVIEW.exe). Run the LabVIEW VI that calls the library, and when your VI calls the DLL you will see the breakpoint hit in Visual Studio.

Creating a Console Application
Alternatively, you can quickly create a Console Application to test your library. In the same Visual Studio Solution, create a new project of type Console Application, use it to access the methods in your library, attempt to run it, and print troubleshooting information to the console. In this way, you can isolate your testing to just the C# library, without involving the LabVIEW code.
Review the Errors on the Property and Method Nodes
The errors that come out of the C# nodes can give you a clue as to what’s happening under the hood. When an exception occurs in the DLL, you’ll get a pop-up like this in LabVIEW.
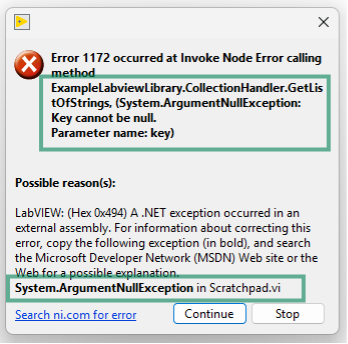
I have annotated the parts of the pop-up that include information that is helpful for troubleshooting. When searching for information on these errors, make sure you don’t include the LabVIEW-specific sections and use only the actual C# exception. All errors from a .NET node have LabVIEW error code 1172 (shown at the top). The actual exception from .NET, which will be useful in your search, is shown at the bottom.
Do you have a complicated driver or library that you need help with? DMC loves a challenge! Submit an inquiry today, and we will be happy to help.
Ready to take your test and measurement project to the next level? Contact us today to learn more about our solutions and how we can help you achieve your goals.


