This blog will show you how to remotely debug code that has been deployed to Microsoft Azure as a Function App.
During one of the project stages, for various reasons, I was not able to deploy additional logging to see the parameters that were being retrieved from a database. You might think that I could’ve simply run the code locally and seen the results there, but locally I had no access to the database due to the client’s firewall configurations.
The only plausible solution was to attach the debugger to the code that was running on the cloud. Seemingly, there are two main solutions in the 2022 Visual Studio, and it took me a little longer than I wish it did to connect to a remote process. To save you some time, I have summarized the steps I took while trying to review possible edge cases that might help you with troubleshooting.
I put this guide together for both solution options, but I do have to warn you that even though the Publisher seems like a better, faster, and easier option, it did not work for my case, and I had to resort to the more manual option (which I, personally, prefer anyway).
Both options must enable remote debugging.
Firstly, you will navigate to the “General settings” subpage of the “Configuration” tab of your Function App and enable remote debugging. Enabling this setting allows you to connect a remote debugger to the code running on the cloud.
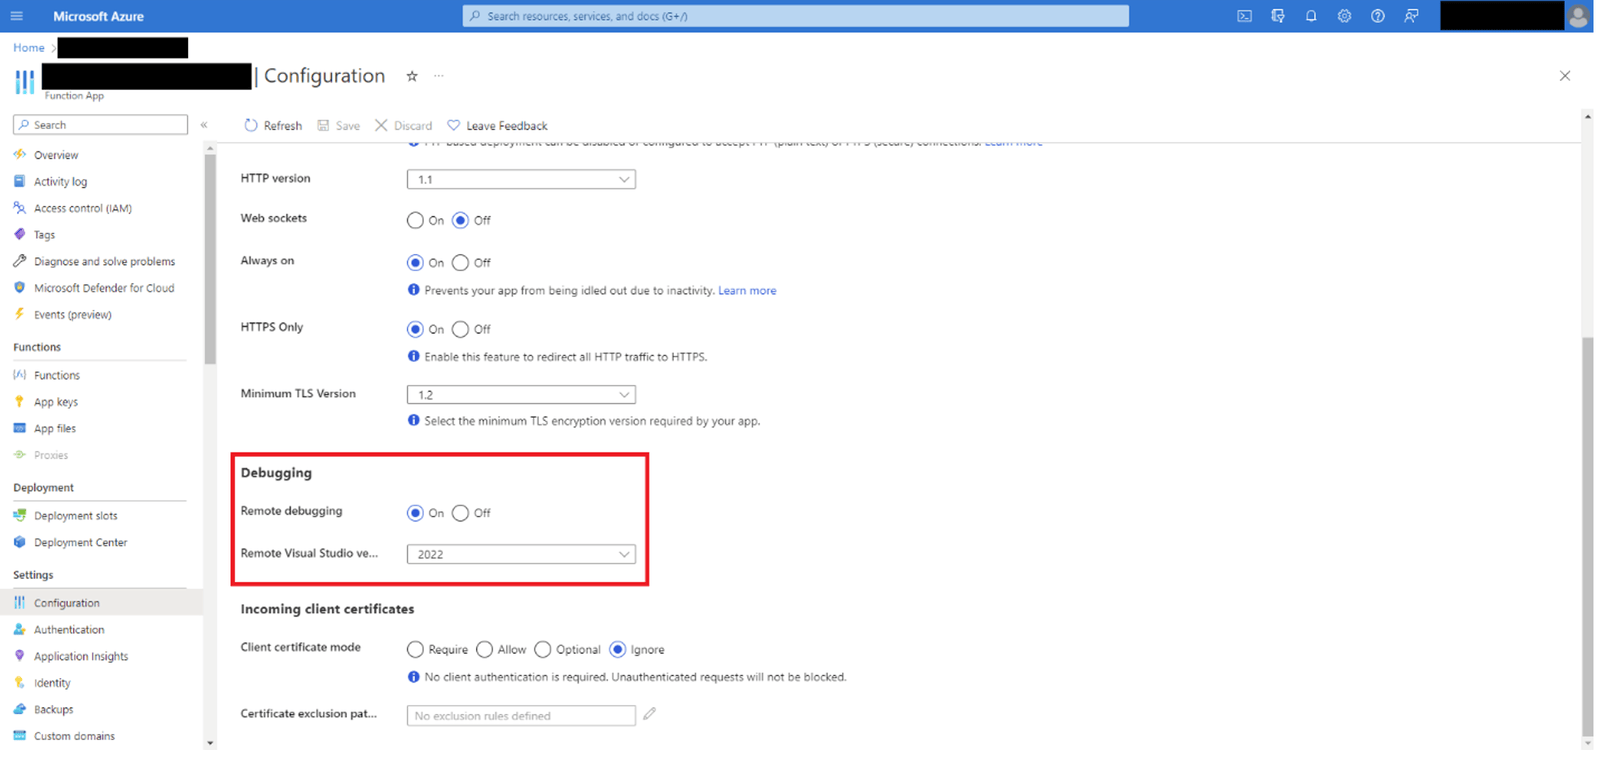 Image 1. Enable remote debugging in Azure Function App configuration.
Option 1 – “Attach to Process” in the Debug drop-down menu.
1. For option one, you will navigate to Visual Studio and select “Attach to Process” under the “Debug” option of the top bar menu panel. This item has a handy shortcut: Ctrl+Alt+P.
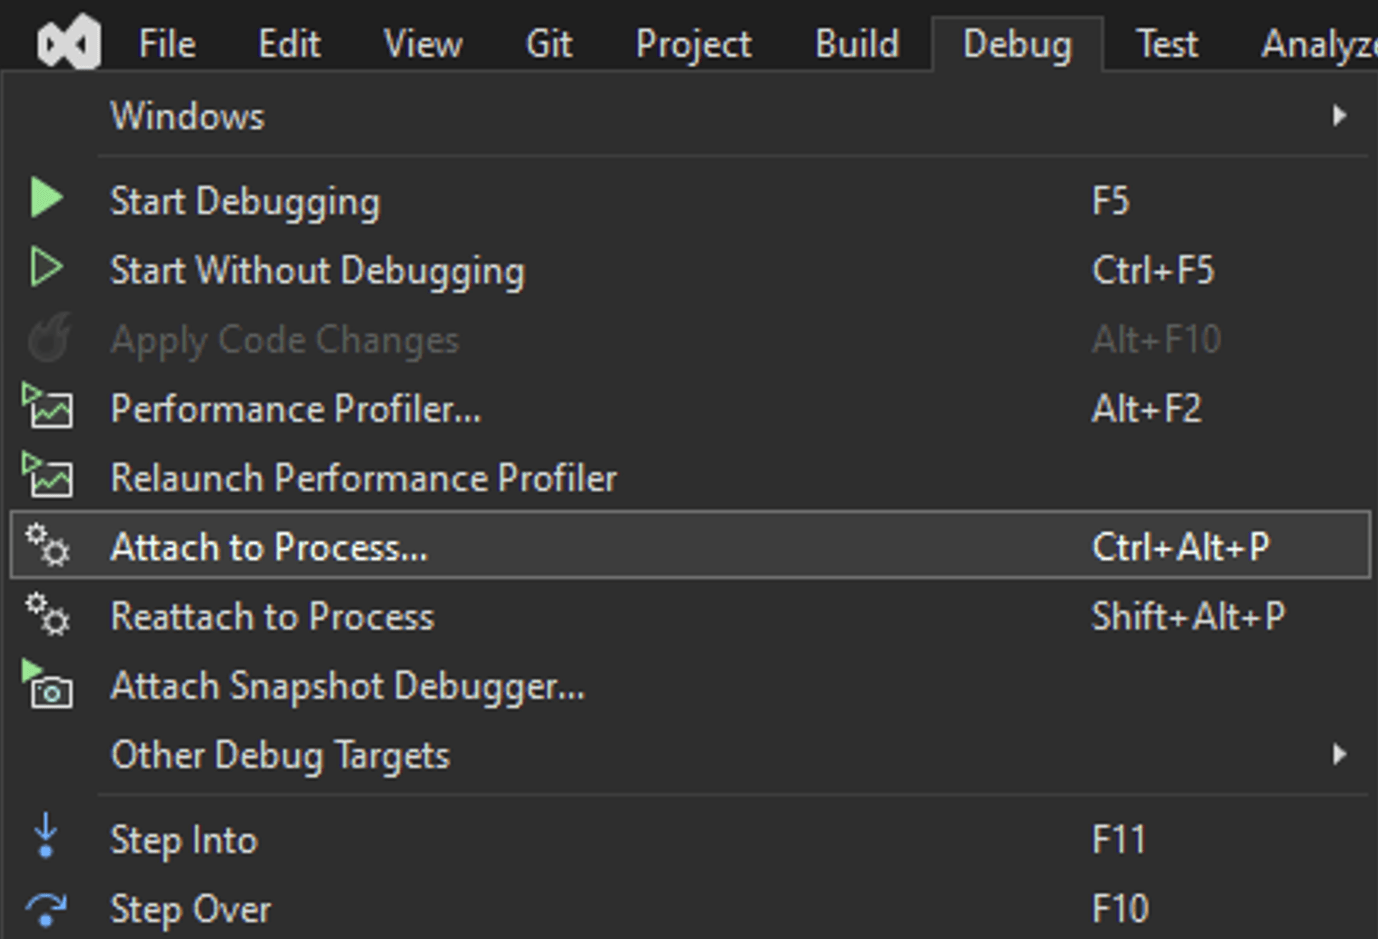
Image 2. Select “Attach to Process” in the drop-down menu or use a Ctrl+Alt+P shortcut.
2. You will have to provide the connection target, which you can find in the “Overview” of your Function App. The target is the URL to your Function Application with an appropriate Visual Studio port. Don’t forget to omit the https:// part of the URL.
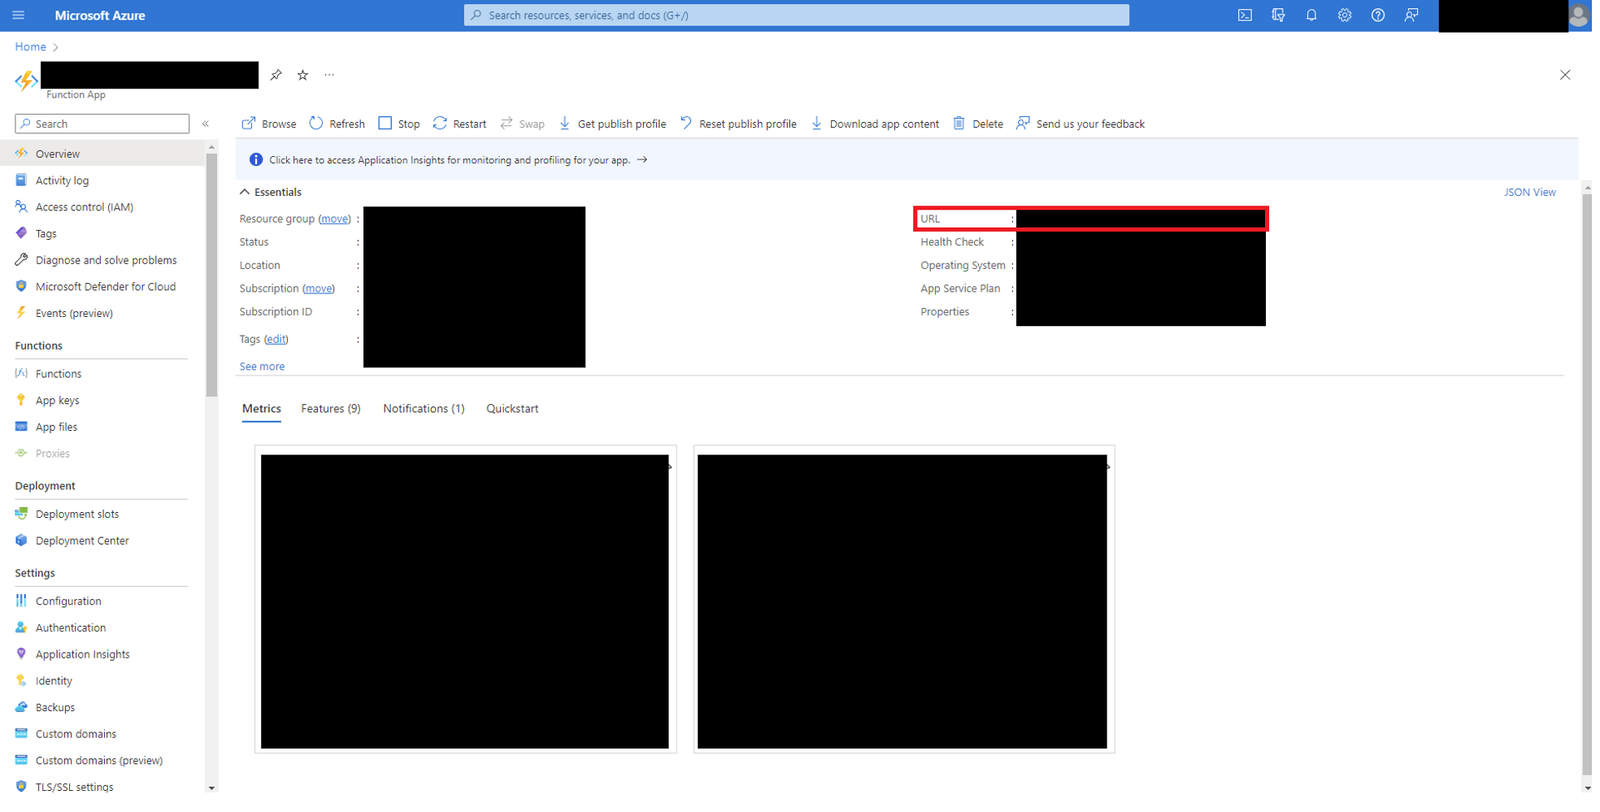
Image 3. Copy the target URL from the Function App Overview page.
3. Visual Studio port is determined by its version (taken out of official Microsoft documentation as of January 2023):
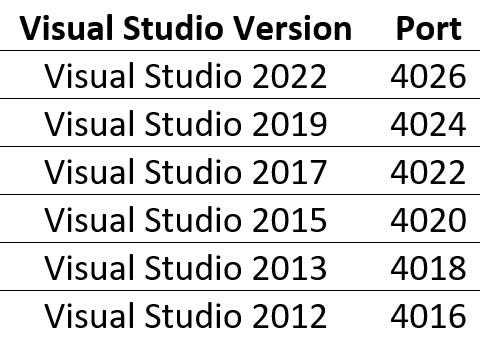
Note: I could not attach to a process using port 4026 because remote debugger ports on Microsoft Azure App Services are configurable, and they do not use the default ports associated with your version of Visual Studio. They use port 4024 for the remote debugger.
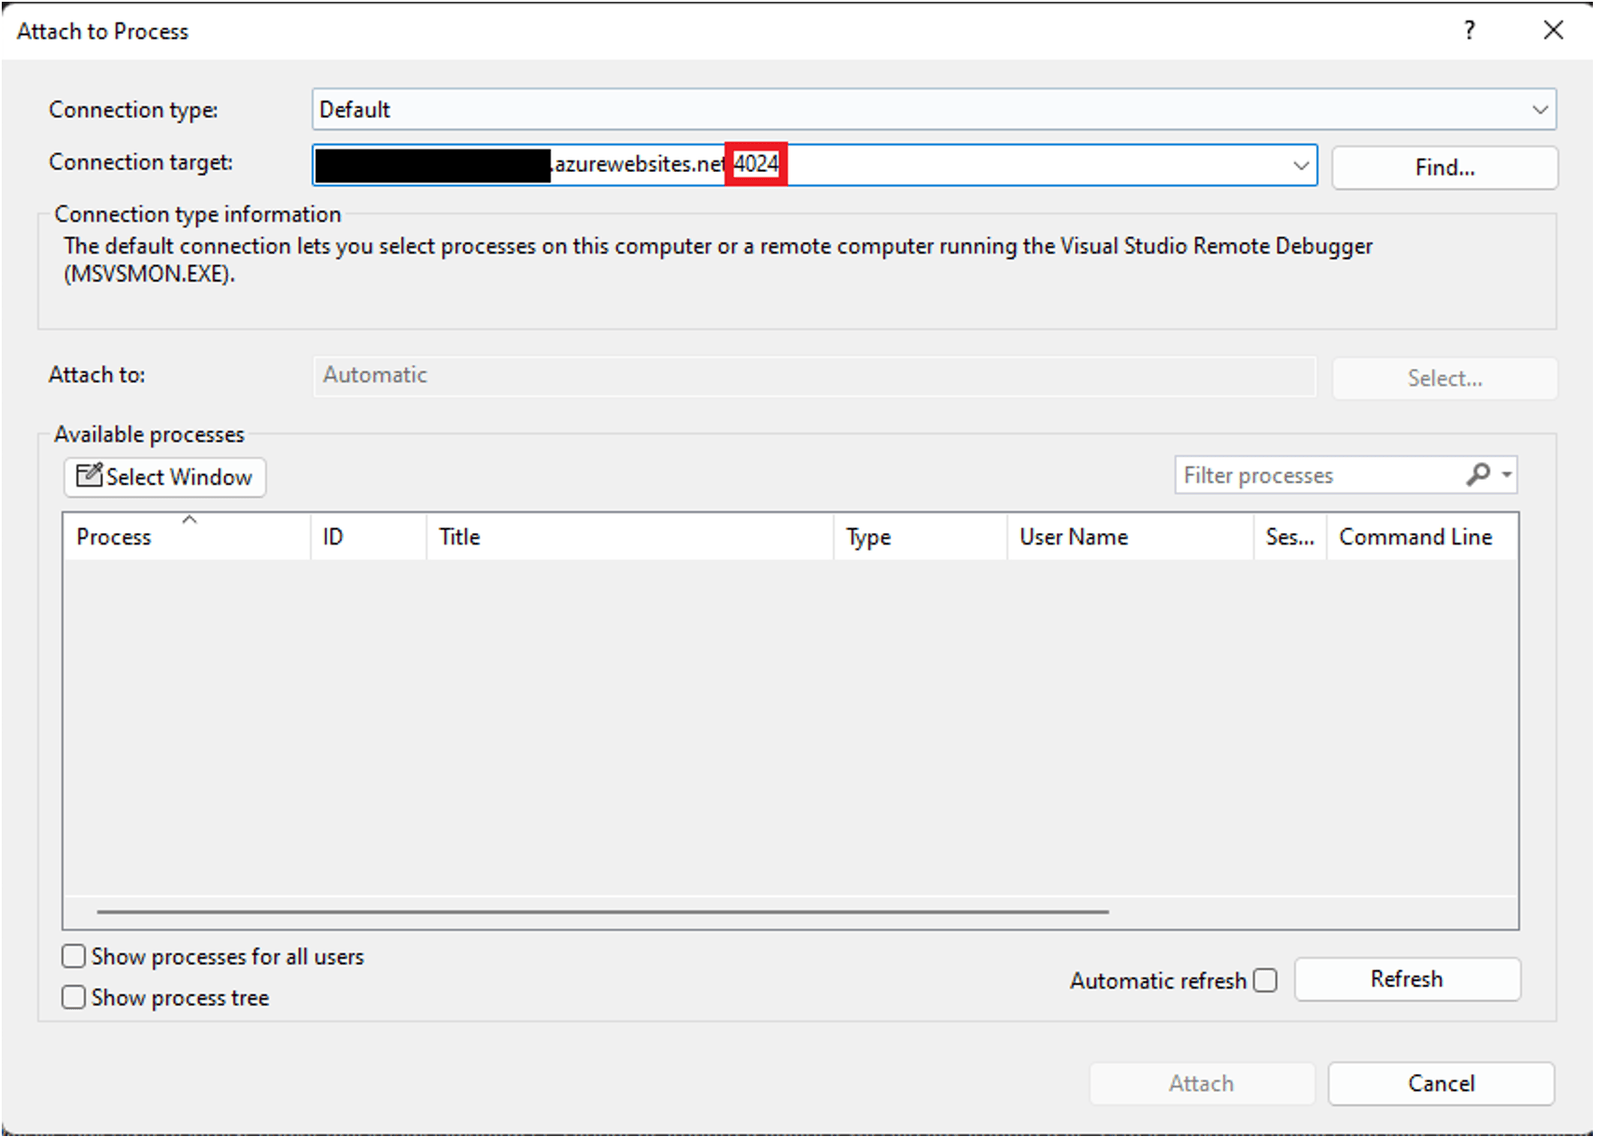
Image 4. Use the target URL with an appropriate Visual Studio port.
4. Without clicking anything, press Enter after you are done inputting the connection target. This will prompt a window for your credentials. This part is a little misleading because, in my case, the authentication window automatically prompted me to give my laptop credentials, but those are not the ones you want to put in here. Instead, select the “More choices” option and then hit “Use a different account.” This will prompt for a username and a password — which you can find in Azure. Disregard the “Domain” part of the window as it will get populated automatically if you use the correct username.
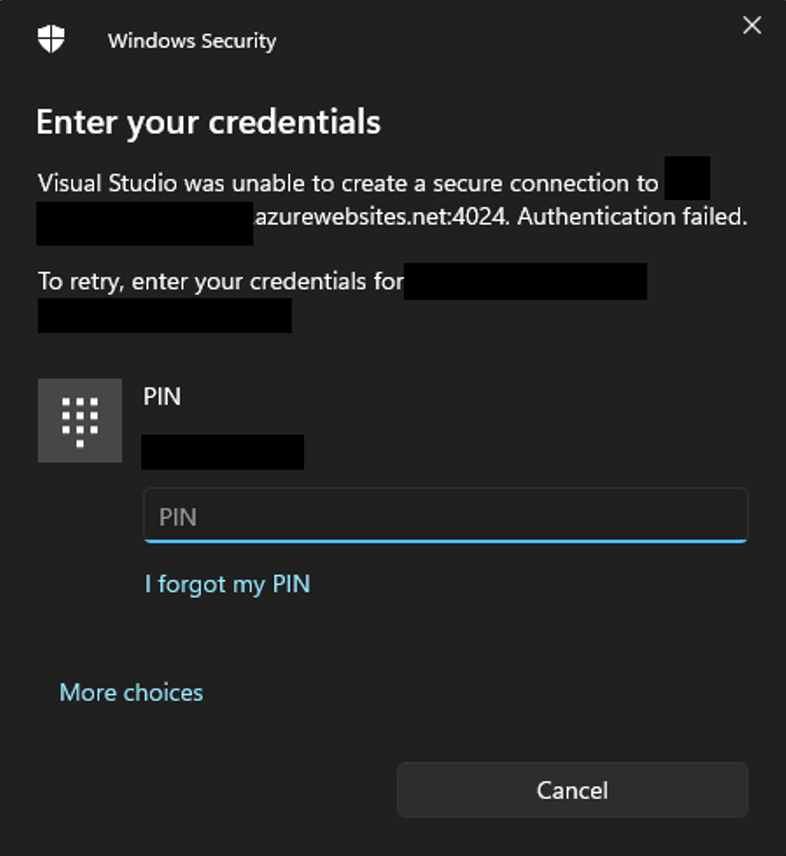
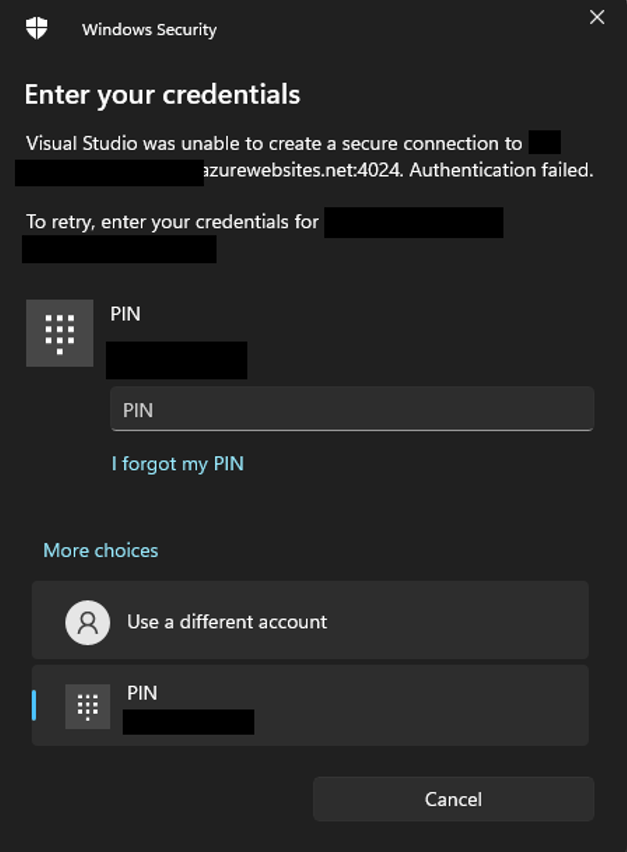
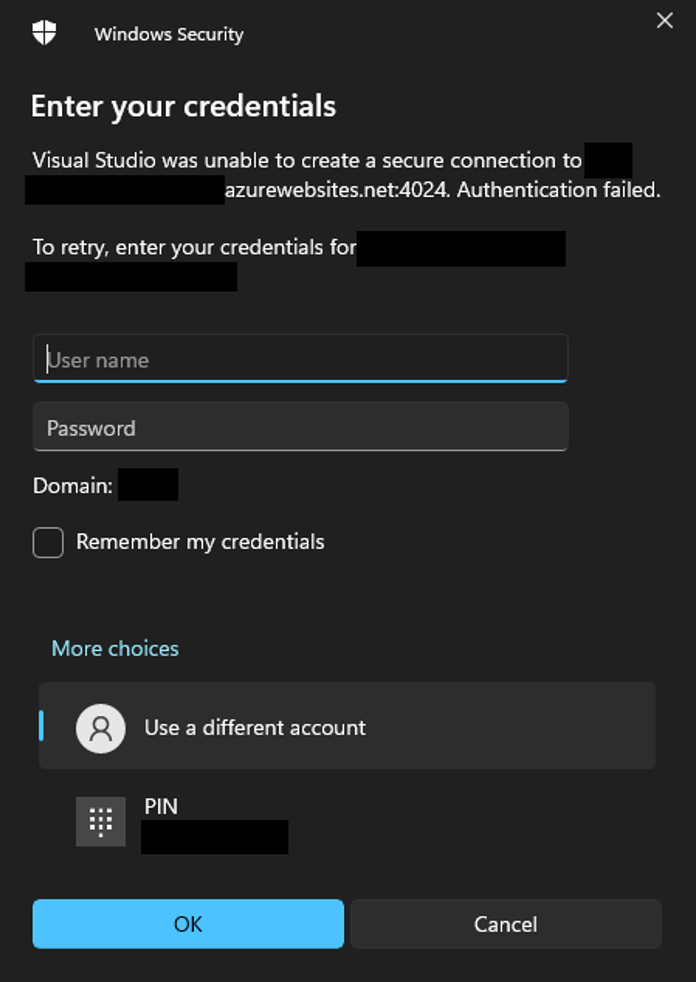
Images 5, 6, 7. (Left to right, top to bottom) These are steps 1, 2, and 3 in navigating to a window where you provide credentials to connect to your application.
5. The credentials you are going to use to connect to remote processes can be found in the “Deployment Center” of your Function App. Navigate to the “FTPS credentials” subpage and copy the username and password exactly into the window that prompted you for credentials. You can also add user scope, but I did not see the necessity for it for my case.
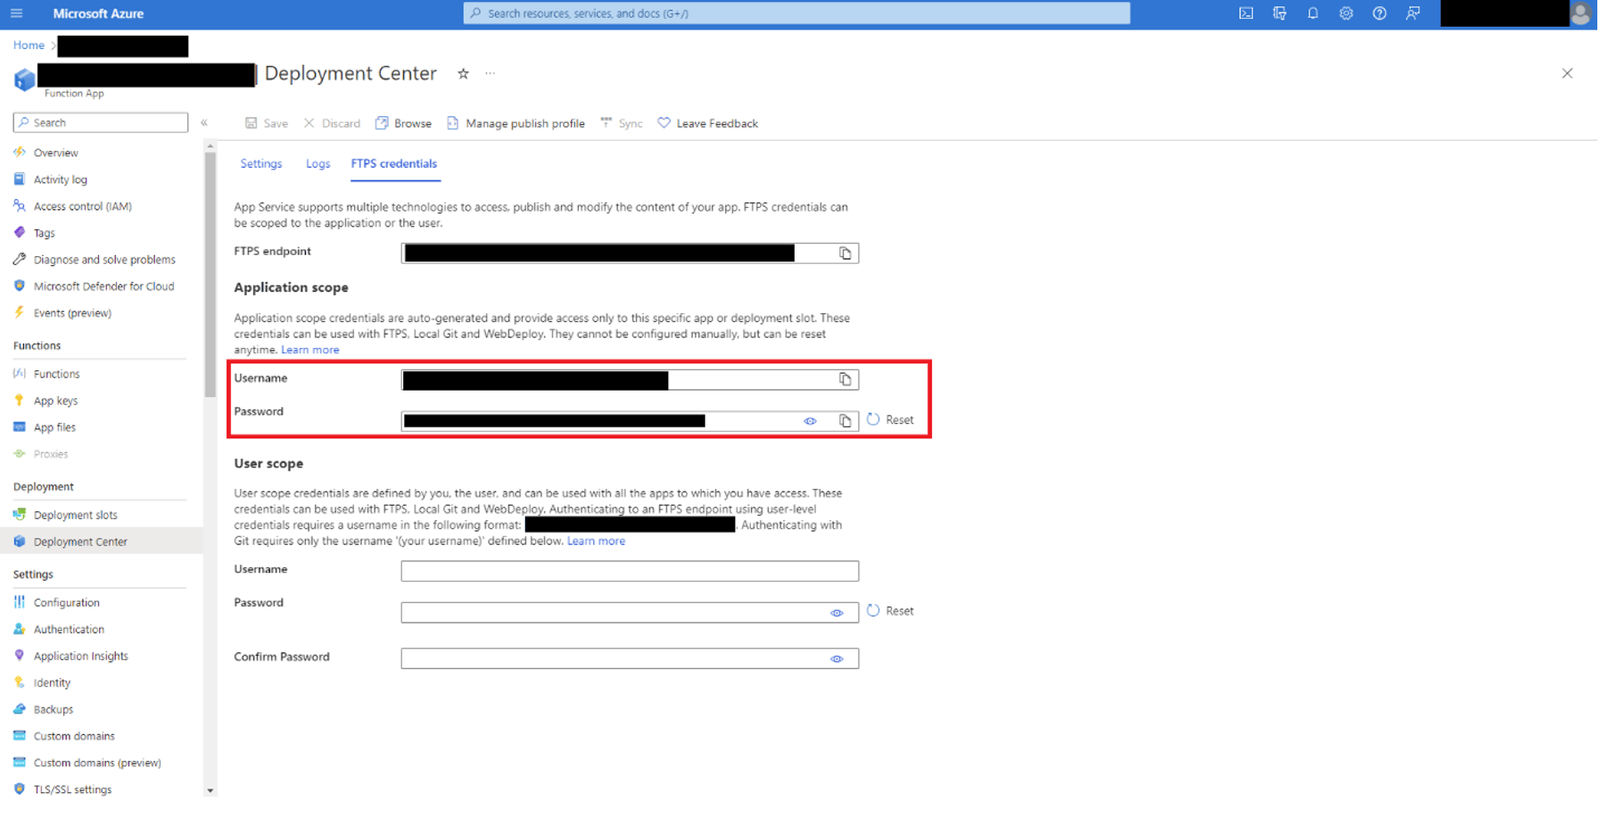
Image 8. Find credentials in the deployment center of your application.
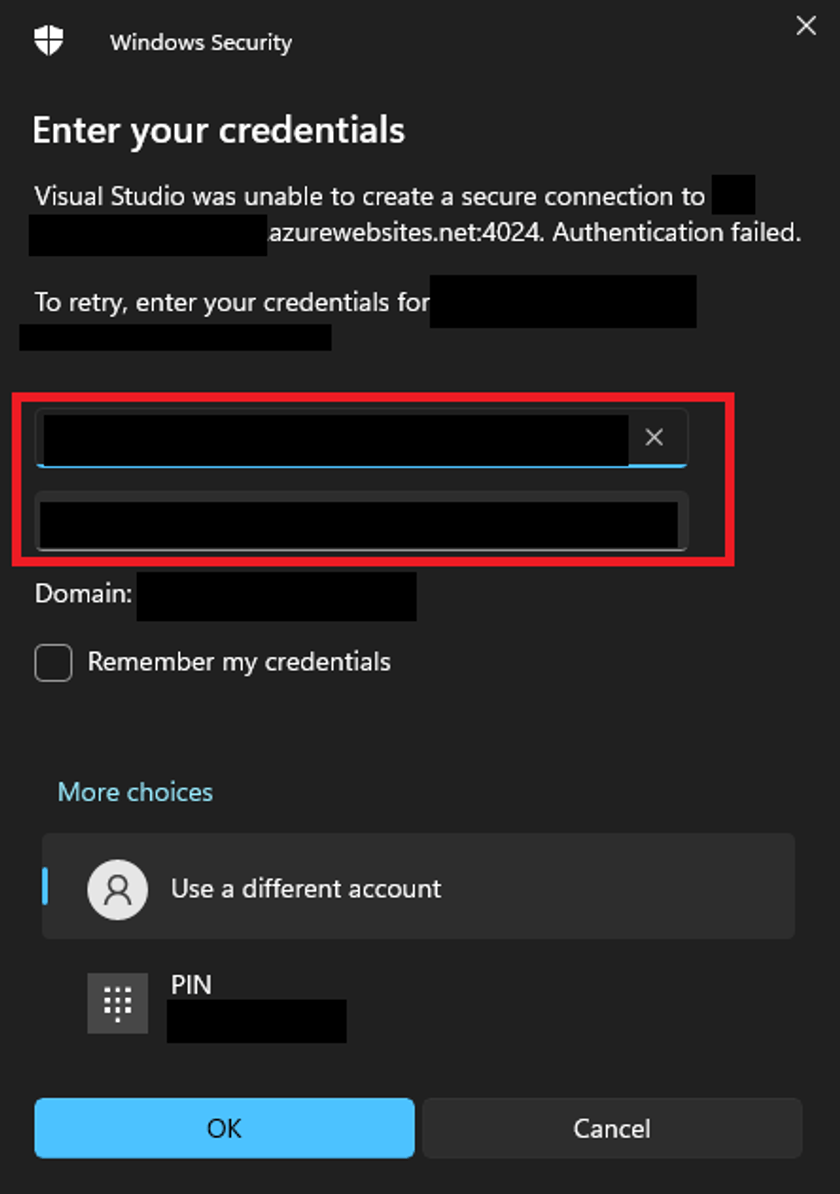
Image 9. Use the credentials to attach the debugger to your target.
6. If the connection successfully establishes, you will see various processes that you may be able to attach to. Since my application is an Azure Function App, I was only able to attach to dotnet.exe - .NET Core Host. I have seen online that, to attach the debugger to a Web App, you might have to use the w3wp.exe – IIS Worker Process.
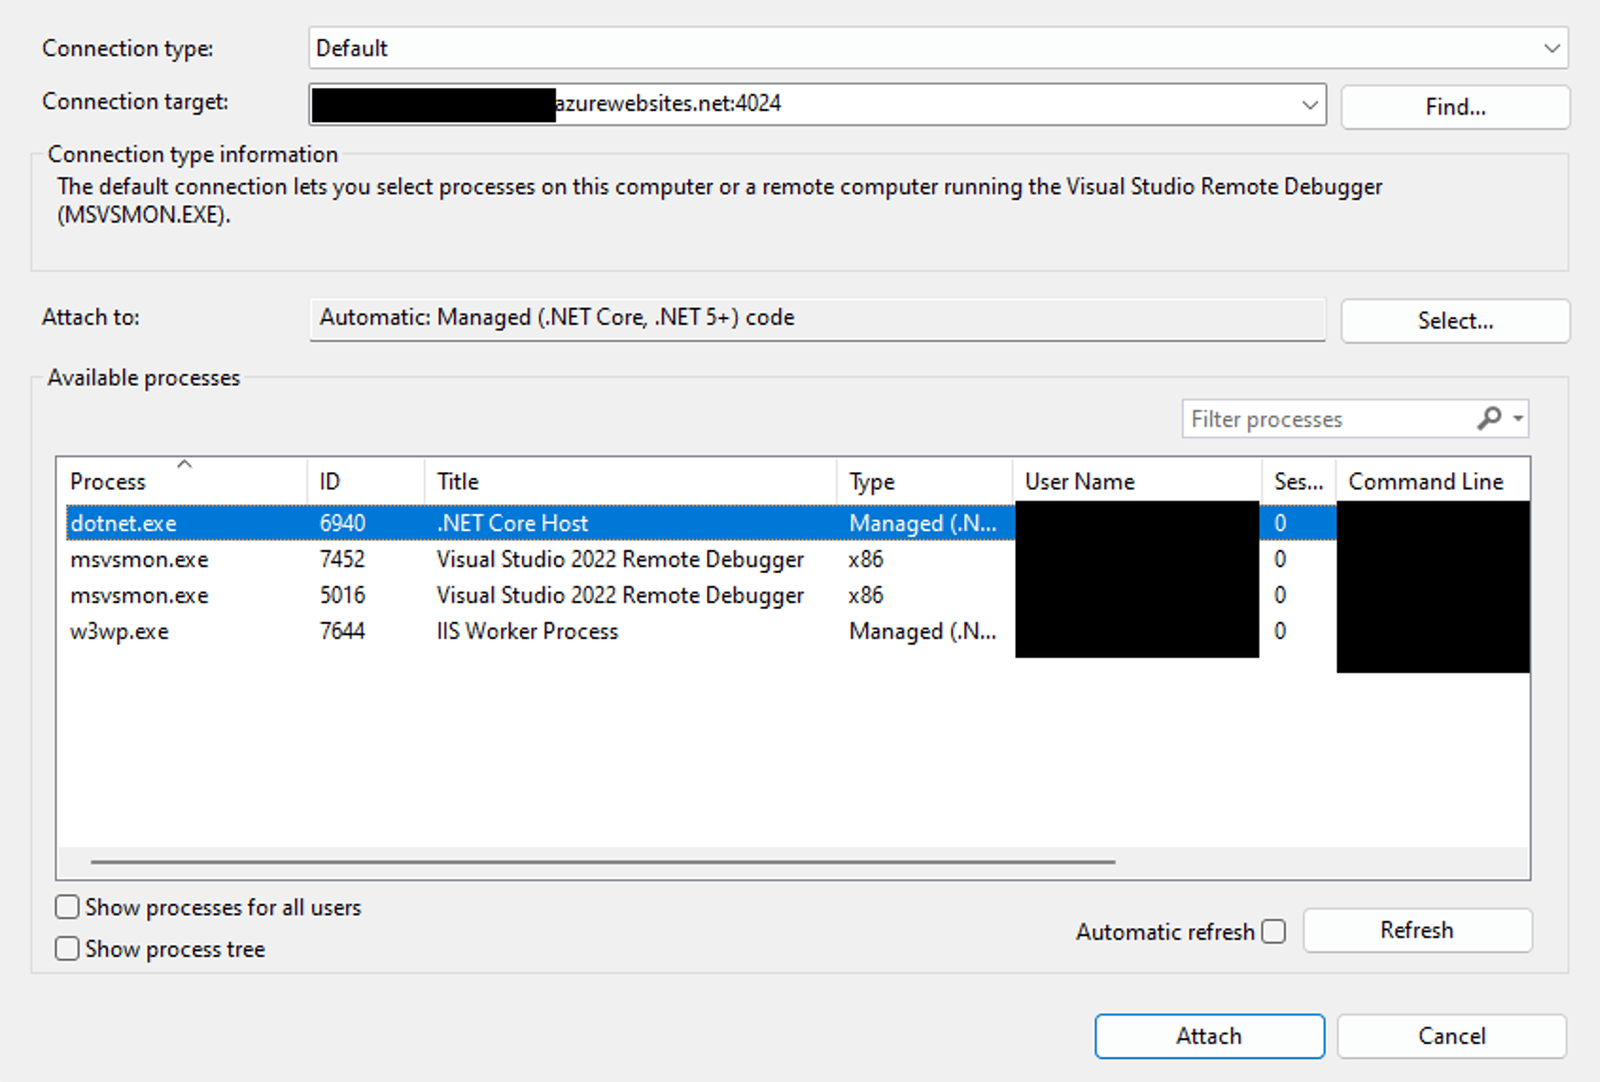
Image 10. This is a view of processes to attach to.
7. Once attached, you should be able to successfully set a breakpoint in your code. Since the app runs on cloud, there is a slight latency, and it might take a little longer for the code to hit the breakpoint or for you to set it — but it is almost negligible. If the breakpoint doesn’t get set or if you encounter other issues along the way, check out this blog I used when troubleshooting.
Option 2 – Visual Studio Publisher
1. If you have used the Publisher before, you might not even need this guide, that’s how straightforward this method is. If not, let’s look at how you can use the new features of Visual Studio to your advantage.
Firstly, you will have to create a Publishing Profile. Right-click your function app in Visual Studio and select “Publish” option. This will prompt you to set up a Publishing Profile.
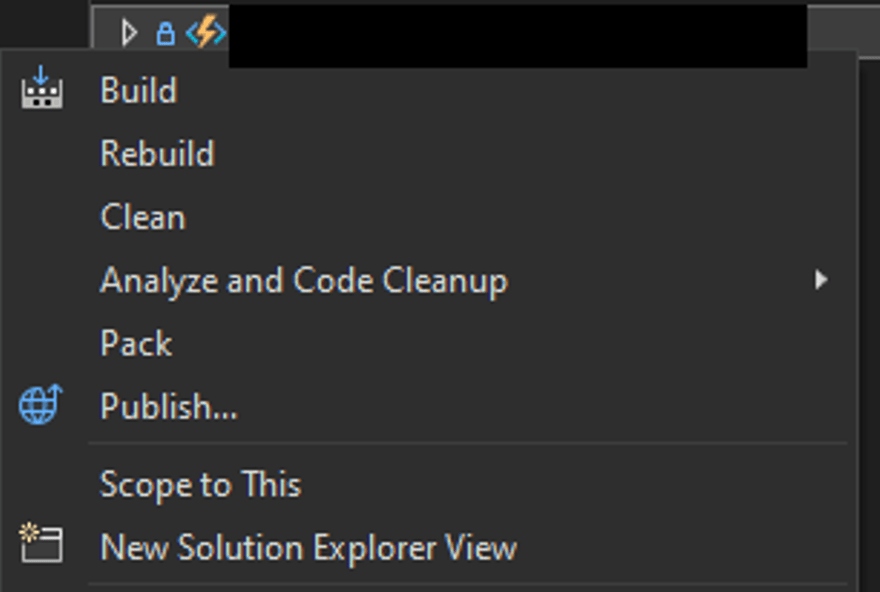
Image 11. These are options for your Function App.
2. Since we are trying to attach the debugger to a Function App on Azure, we will select the Azure option.
Image 12. These are publishing options.
3. By default, my example runs on a Windows Azure Function App, and that is the option I selected.
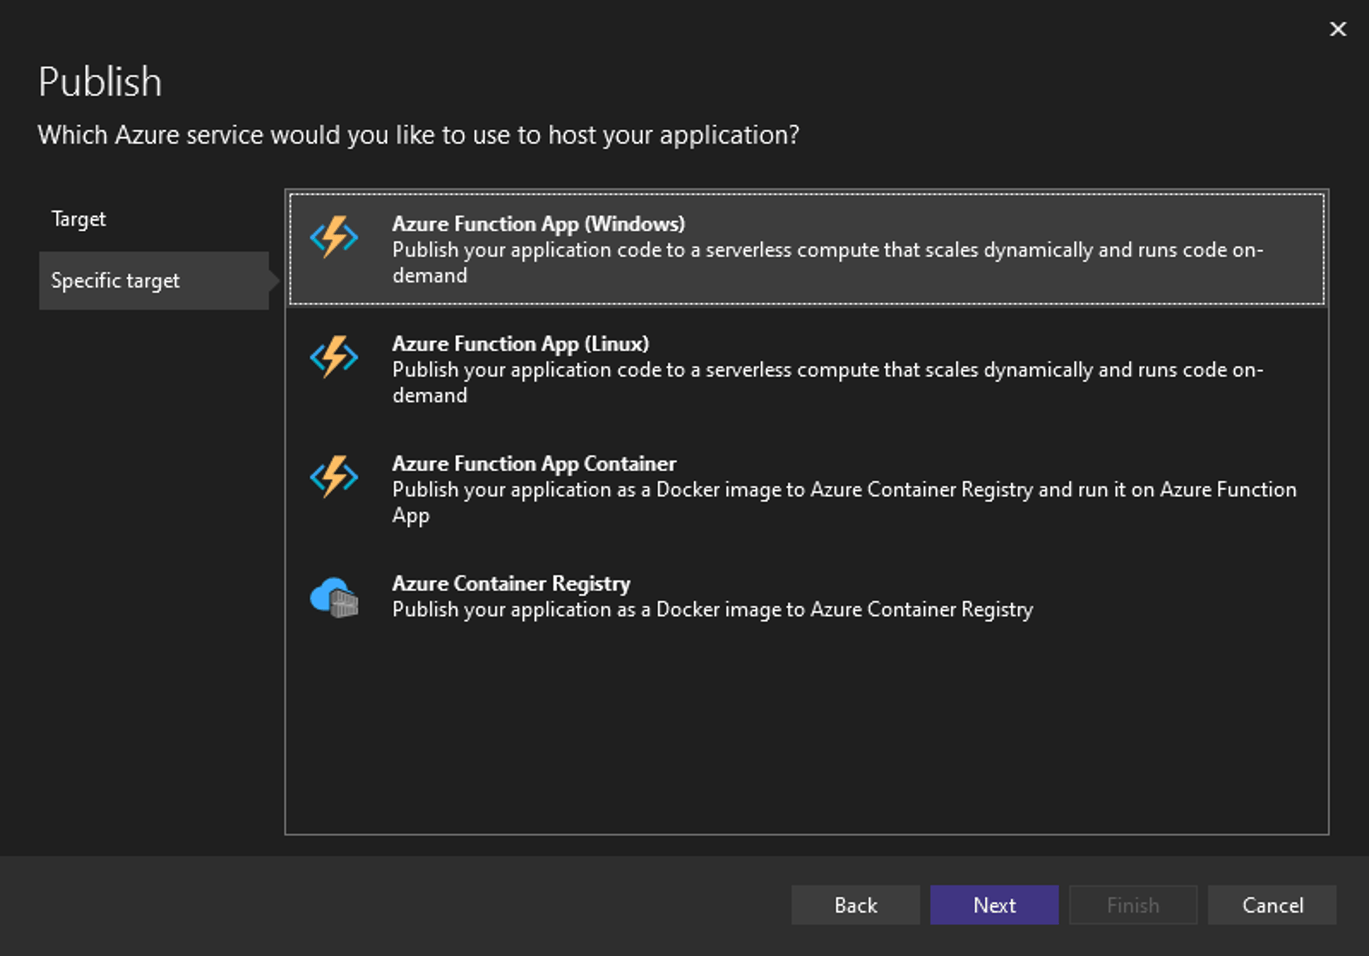
Image 13. These are Azure services options.
4. The next step is to select which Function App you want to connect to. I can’t really help much here because you will need to choose which app, service, and resource you are attaching based on your environment setup.
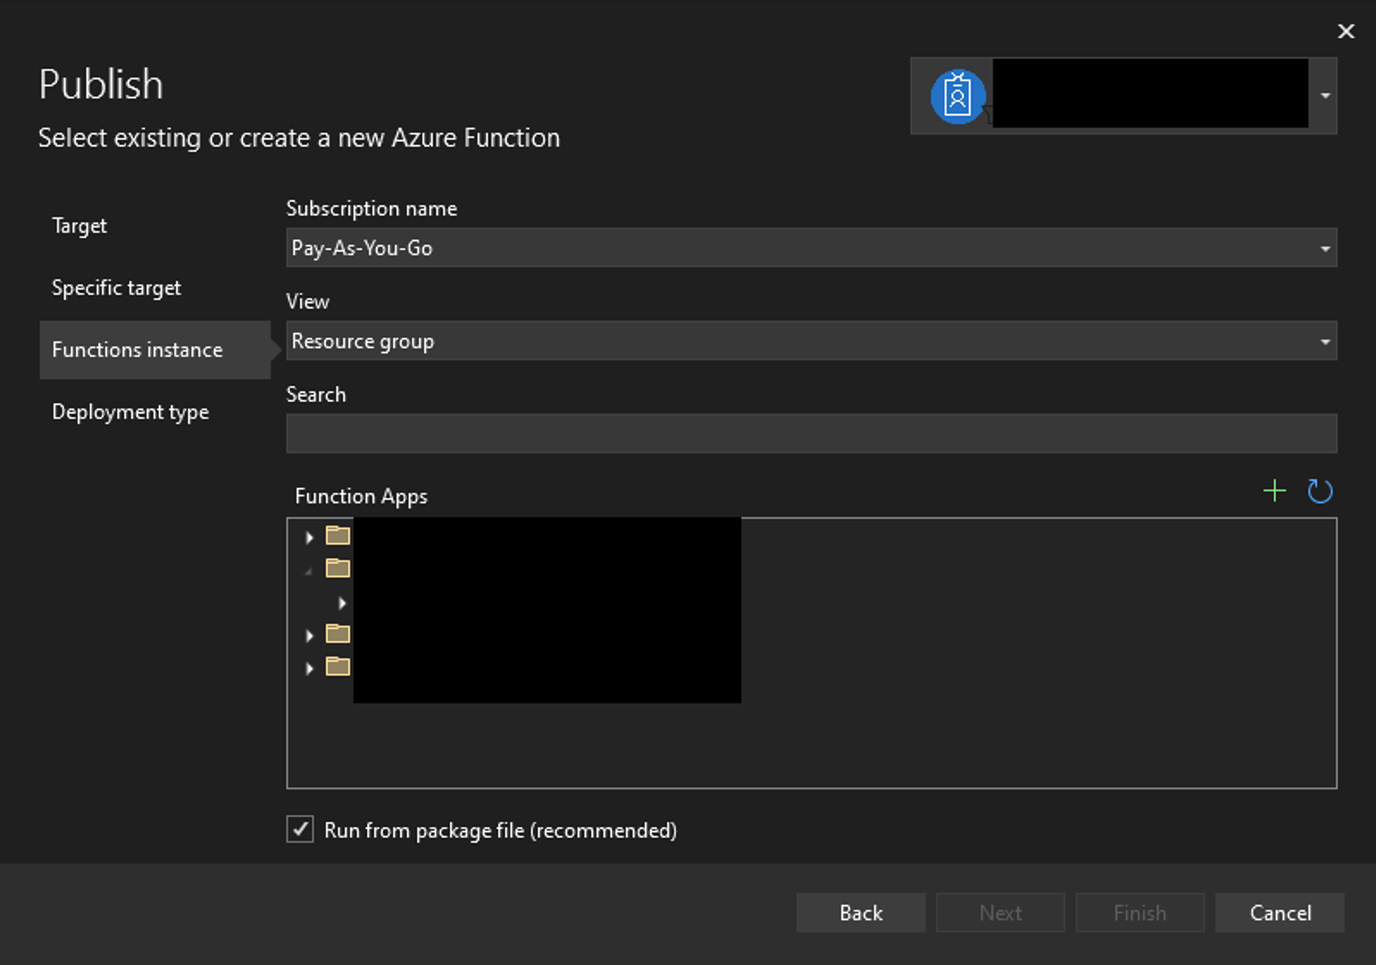
Image 14. Select the Azure Function App for which you are creating this Publisher.
5. You can hit “Finish” because the next window is optional. It asks if you want a pubxml or a yml file and, for the purpose of this guide, you should select the default pubxml.
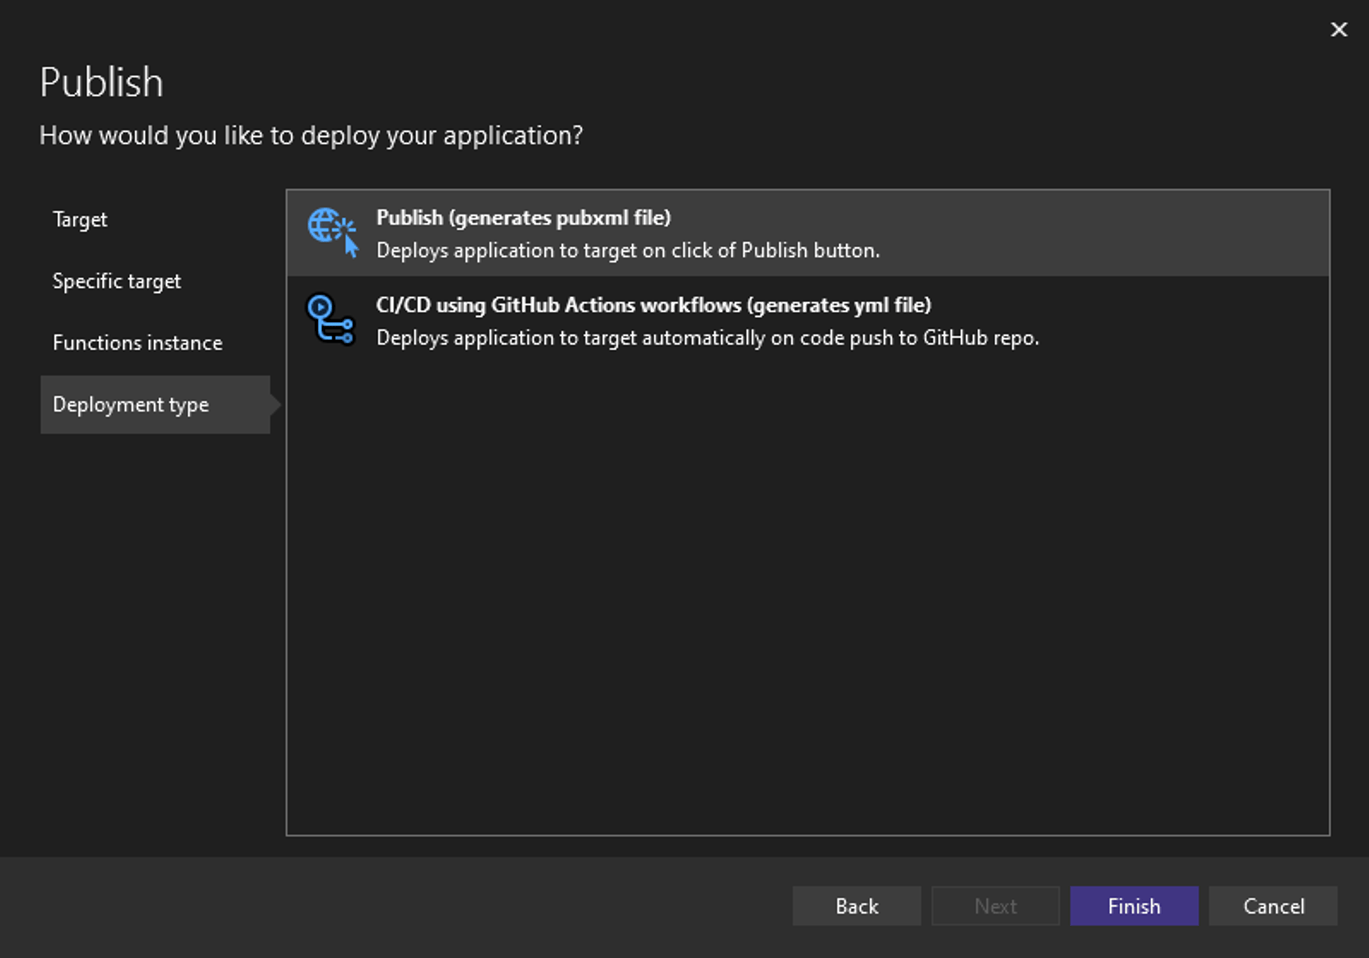
Image 15. These are Publisher format options.
6. Once you click “Finish,” this will automatically create the Publisher Profile for you. Successful creation will show an appropriate message.
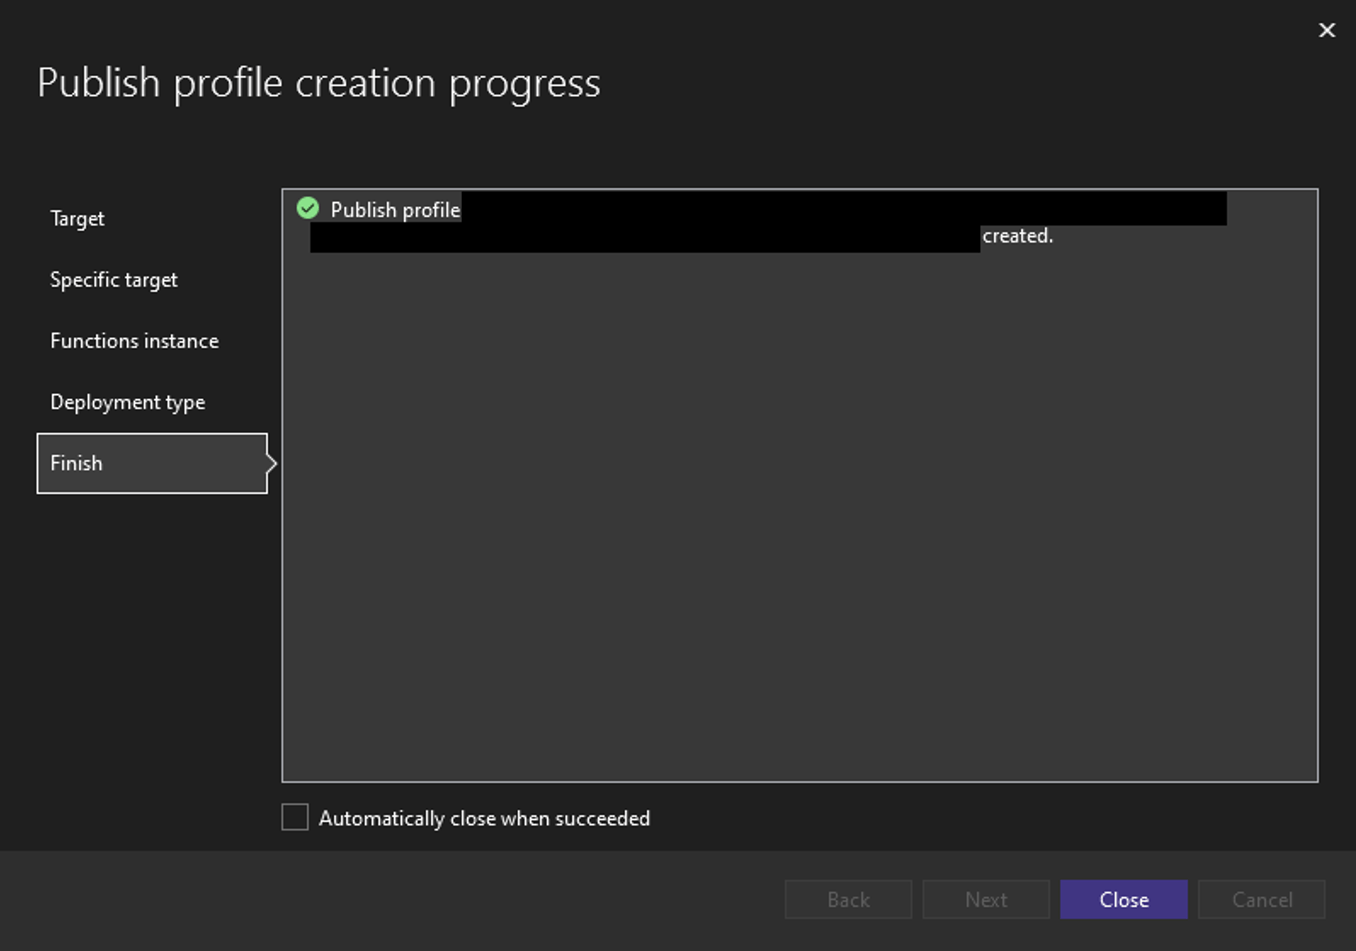
Image 16. This displays the successful creation of a Publisher Profile.
7. Now you should simply be able to navigate to the options of the Profile and select “Attach Debugger.” Make sure you publish the application in Release mode using this Publisher before attaching the debugger. This is all you need to do if you are using the Publisher. This did not work for me because the default process that the Publisher attaches to was not the Function App that I needed to debug. It was w3wp.exe – IIS Worker Process instead of dotnet.exe - .NET Core Host by default.
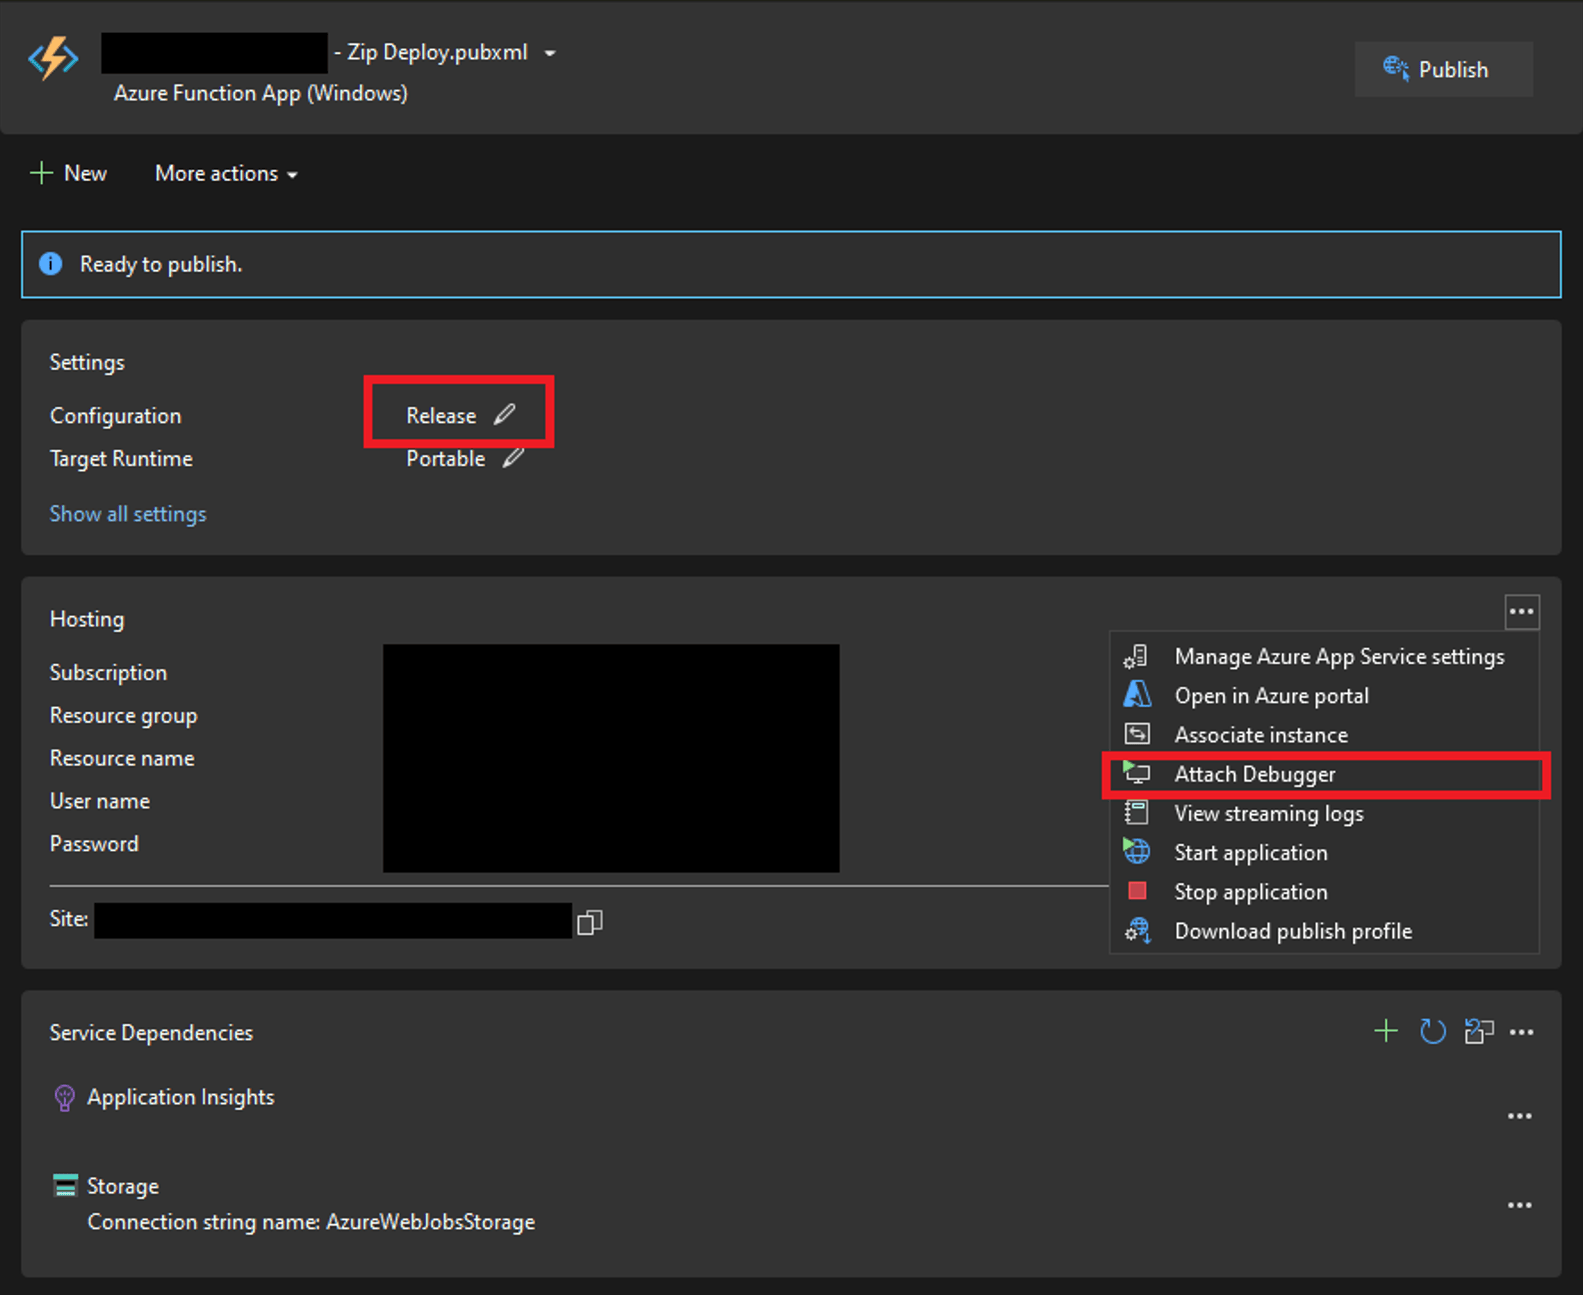
Image 17. This is a Publisher interface to attach the debugger.
Important troubleshooting notes:
- Your code must be up to date with the current version on the cloud. Even though I had the latest version of the code, I had to redeploy to attach the debugger. This especially applies to the Publisher Profile.
- When attaching to process, you might have to manually figure out where to attach. As I was debugging a .NET Azure Function Application, I had to attach to the dotnet.exe process, but I have seen tutorials where you had to attach to w3wp.exe for certain web applications.
- The credentials are not your laptop nor your account credentials. They are the FTPS credentials from the Deployment Center of your application.
- It seems that the Publisher option configures everything for you. The feature seems nice, but it did not work for my case. I had to specifically attach to the dotnet.exe process because all other processes would not load any symbols, and the Publisher had the same issue for me. It wouldn’t load the symbols, so I could not really set any breakpoints and debug the code. I imagine that it connects to w3wp.exe by default as I have seen in other tutorials.
- Another quite crucial note is that, when you attach to process, you only attach to one process. That is, if your application is multi-threaded, then you will only attach to one thread. I learned it the hard way. Every time I attached to a process and sent a request, the breakpoint would not always get hit, and sometimes I would receive requests that I have never sent. If you do decide to proceed with this debugging technique, be prepared to rely on chance and make sure that no one else is utilizing the application because they will see some weird behavior of their processes getting stuck on your breakpoint.
- I have seen situations where people had to disable the “Just My Code” option to make this work, but I never saw the necessity in that. I have it turned off by default, but having it on should not cause any issues; however, you can try it if nothing else is working in your troubleshooting endeavors.
- Microsoft documentation on “Just My Code”
- If you are using a Publisher, make sure to deploy the code under the Release mode.
Learn more about DMC’s Microsoft Azure Cloud Solutions and Services and contact us today for your next project.