SQL Server Reporting Services (SSRS) comprises a set of tools provided by Microsoft to create, deploy, and manage paginated reports in an '.rdl' format. Report Definition Language (RDL) is an Extensible Markup Language (XML) version of the report that can be modified directly through the XML or through an application such as Microsoft Report Builder or Report Designer in Visual Studio. Microsoft Report Builder can be a more attractive choice if the developer is not interested in downloading or learning Visual Studio.
When working with Report Builder for the first time, I thought it was mostly straightforward and consistent with other Microsoft tools; however, it definitely had some quirks that I found out about along the way. This blog will provide solutions to a few issues I ran into so that you can prevent them and avoid any frustration.
1. Be Careful with the Page Size, Layout, and Margins.
When working with the page size, you must be careful not to place components outside of the desired page width. Assume you are working with a landscape report with dimensions of 11 inches in width and 8.5 inches in height and that the default margins are 0.5 inch all around. This means that the body of your report should be 10 inches in width. SSRS will automatically adjust the height based on the contents of your report.
In the early stages of developing reports, I would often accidentally drag table widths to be slightly larger than 10 inches wide. Unfortunately, Report Builder will automatically update the Body to be wider as well, so I didn't realize my error until running the report and choosing Print Layout.
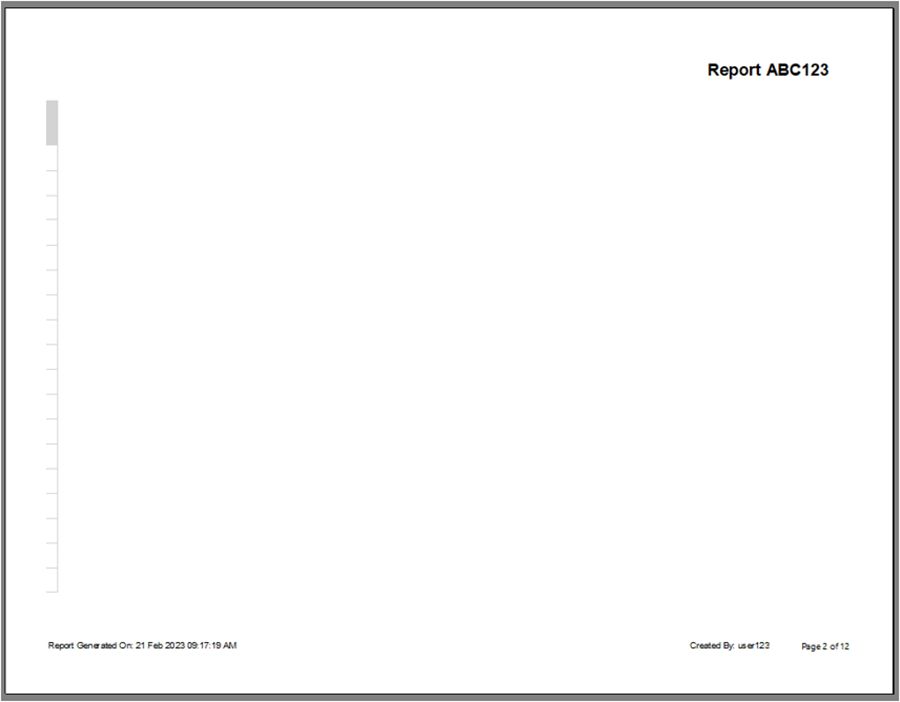
If you run into this error, it may look like your report has empty pages that just contain the overflow width of the previous page: as shown in the image below. You will need to fix this issue by checking that all report components are within the 10-inch width. If they are, and you are still getting this error, it may be because the Body width was increased and will need to be reset to 10 inches.
Sometimes, after adjusting table or Body widths, the Report Builder would overwrite my changes with the incorrect value. If Report Builder is refusing to cooperate, it is sometimes easier to open the .rdl file in a text editor and update the XML as needed.
2. Pre-process Data in SQL Queries Instead of in Report Builder.
If you are comfortable working with SQL queries and code, it may be easier to process and format data through queries than through Expressions in Report Builder. For instance, I was creating a report where all null values needed to be displayed as 'N/A'. I found it easier to add something like 'COALESCE(value, 'N/A')’ to my SQL query than it was to update every textbox in Report Builder to have an expression such as 'IIF(IsNothing(value), 'N/A', value)'.
Although updating the Expression in Report Builder only requires a couple of extra clicks, if you are doing this often enough, you can lose quite a lot of efficiency. I also I found that, when updating Expressions, I would sometimes drag the textbox itself and change the width, height, or position accidentally. I would then have to remember how to change that style back — which would waste even more time! So, if you can, add formatting and data processing in the query itself so you can simply use the value in Report Builder.
Additionally, it is best practice to put your queries into stored procedures if the environment you are working in permits the creation of stored procedures. Calling a stored procedure instead of the query directly allows SQL to optimize the query since it can reuse an execution plan to run the stored procedure.
3. The Order of Your Parameters Matters!
Report Builder allows you to use a few different types of parameters. You can have a user defined parameter where the user is required to enter in the value for the parameter, a calculated parameter where the report uses a query to determine the value of the parameter, or an internal parameter that the developer defines and is static when running the report.
If you are using calculated parameters, be sure to define them in the order that they are calculated. Also, make sure that all other necessary parameters are defined before the calculated one. For instance, if there was a user defined parameter of Full Name that was used to look up an Address, the Full Name parameter must be defined before the Address parameter.
The order only matters for calculated parameters, so, if you have internal or user defined parameters that aren't used to calculate other parameters, it does not matter when they are defined.
I think that the easiest way to reorder parameters is by opening the .rdl in a text editor and updating the XML. This allows you to copy and paste easily without needing to remember how your parameters are configured. If you choose to reorder the parameters in Microsoft Report Builder, you will need to delete the parameters and re-add them in the correct order.
4. Graphs can be difficult to style!
When I was creating a report, there were a few graph styling requests that were surprisingly challenging to achieve. The tips listed below helped me to get my graph styled like this:
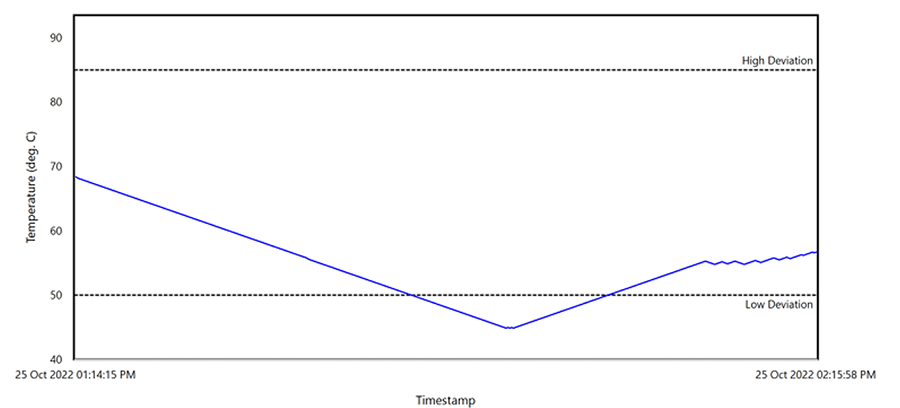
a. Strip Lines are great to use for targets or constants that need to be graphed.
I was required to show the high and low deviation lines for a line chart I was developing. Strip lines were a great way to achieve this effect since I could change the color, style, and width of the line as needed. You can also add a Title to your line and choose its placement. I referenced this article to learn how to use strip lines. The article details use along the x-axis, but the same steps can be taken to add y-axis strip lines.
If you are using strip lines, be careful about the scaling of your graph. SSRS will not automatically consider your strip lines' location when it auto scales, so you may need to explicitly set the Maximum and Minimum values in the Chart Axis properties. If you do not set these Maximum and Minimum values, then it is possible that the strip lines will not appear on the graph. An expression such as 'IIF(Fields!HighDeviation.Value > Max(Fields!Value.Value), Fields!HighDeviation.Value + Fields!HighDeviation.Value * 0.1, "Auto")' seemed to work for me when setting the Maximum value. Also, be careful in case you have a negative value for your strip line since this will change if you need to add or subtract when calculating the Maximum and Minimum values.
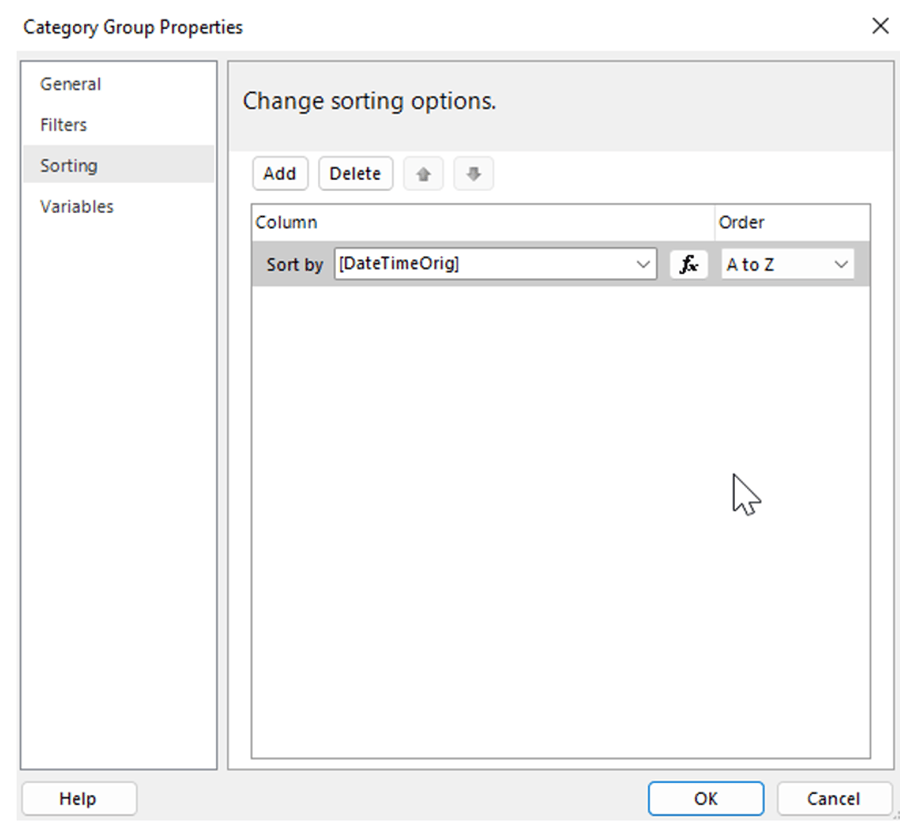
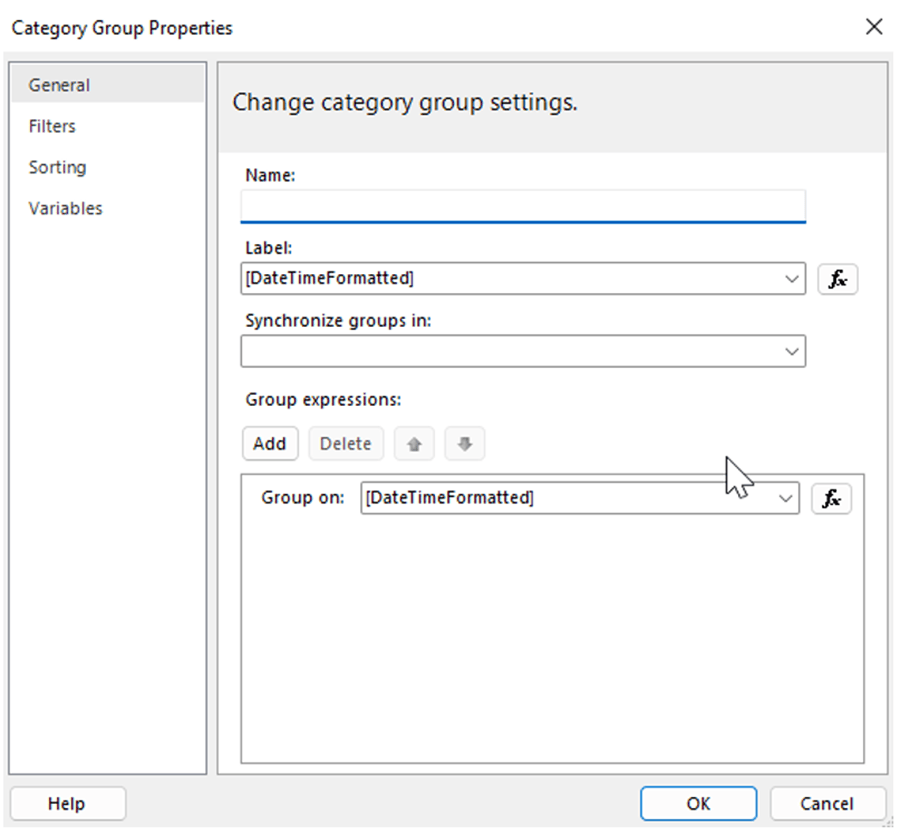
b. Format DateTimes in SQL, but make sure your graph is ordered by the unformatted value.
For the time series data I was plotting, the DateTime needed to be formatted in 'dd MMM yyyy hh:mm:ss tt'. Although the Label Expression could be edited directly, editing it this way caused an issue with sorting, since it would use string sorting instead of DateTime sorting once the format was updated.
To fix this issue, I opted to have two DateTime values, one that was formatted and one that was not. I used the unformatted DateTime to sort the data and the formatted DateTime for the display label. I also chose to format the DateTime in my SQL query like so: "SELECT [DateTime] as DateTimeOrig, FORMAT([DateTime], 'dd MMM yyyy hh:mm:ss tt') as DateTimeFormatted".
c. Use Label Interval and Label Interval Offset to display only the first and last values on the x-axis.
When plotting time series data, having a label for every timestamp can become too much and crowded. At first, I expected that the Hide Labels property would be able to fix my issue based on this post, but I was sadly disappointed it didn't.
Instead, setting the Label Interval and Label Offset in the x-axis Chart Axis properties worked for me! The values used can be seen below.
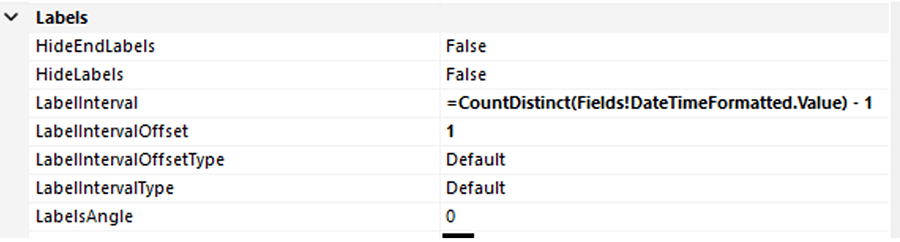
Setting the Interval Offset to 1 ensured I would display the first label, and using the CountDistinct() – 1 ensured I would display the last label. CountDistinct needed to be used because, occasionally, there would be two data points with the same formatted DateTime. This would cause an issue with the labels, and it would cause it to be off by however many repeated labels there were. Using CountDistinct() fixed that issue to ensure the Label Interval lined up correctly.
Summary
Although these tips and tricks are a bit random, knowing even one of them would have saved me a tremendous amount of time. I hope they can do the same for you!
Learn more about DMC's Application Development expertise and contact us for your next project.