Microsoft recently introduced the new Office 365 administrative interface, which provides Administrators with the ability to setup an Office 365 tenant, manage users and subscriptions, and get useful insights into how the Office 365 tenant is used.
The new admin interface is designed to more closely resemble the look and feel of Azure. Enhanced reporting makes it a lot easier for our team to monitor the Office 365 environments of our clients to detect abnormalities and prepare monthly health assessments.
New Interface Features
Along with the new look and feel, the interface comes with some nice new reporting features that are captured on the Activity Dashboard.
Reports are broken down into two categories off the main O365 admin portal side bar.
Usage Reports – Detail how much activity each O365 application has used versus the number of users & activations, storage consumed, and general activity for each user.
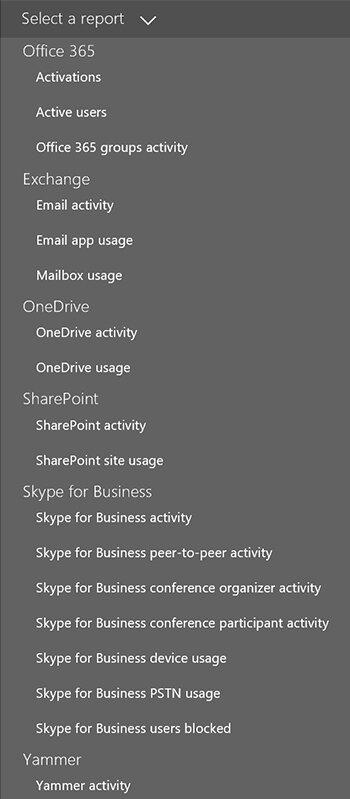
Security & Compliance Reports – Displays information related to auditing and mail protection. These reports show how much SPAM or malware has been blocked from Office 365, as well as how many users have a litigation hold on their mailbox.
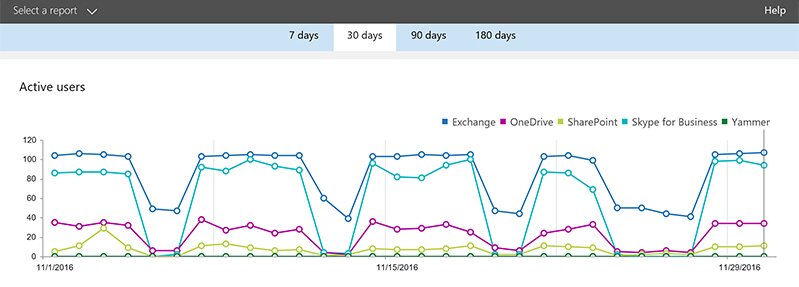
Activity Dashboard
This dashboard allows you to access application level usage information. Microsoft is currently working to enhance the report to offer drill down capabilities to each specific application for additional details within the report.
In the chart below, you can see reports on Exchange, OneDrive, SharePoint, Skype for Business and Yammer.
It offers a helpful, high-level overview of usage. For example, a company that is paying for 175 users would be interested to find out if they only have 140 active users. In a per-user, per month billing structure, a report like this is extremely helpful.
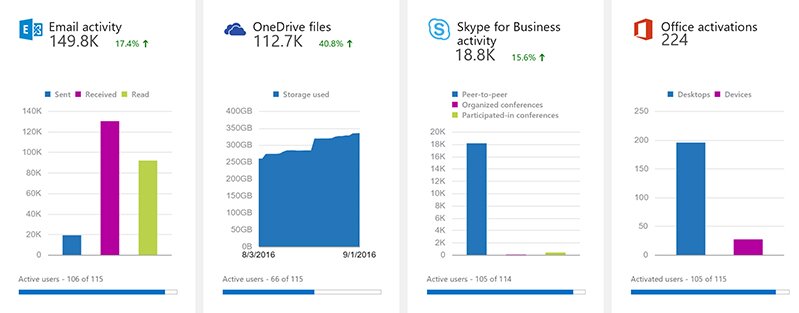
Another new report that is located on the Activity Dashboard directly beneath the Active Users report is the Storage/Activity Report.
I like to look at this report monthly to get a quick snapshot of how much active use is occurring in my Office 365 environment. It’s good to see trends in data, up or down, to make sure no one accidentally deleted 500 GB of data from SharePoint or OneDrive.
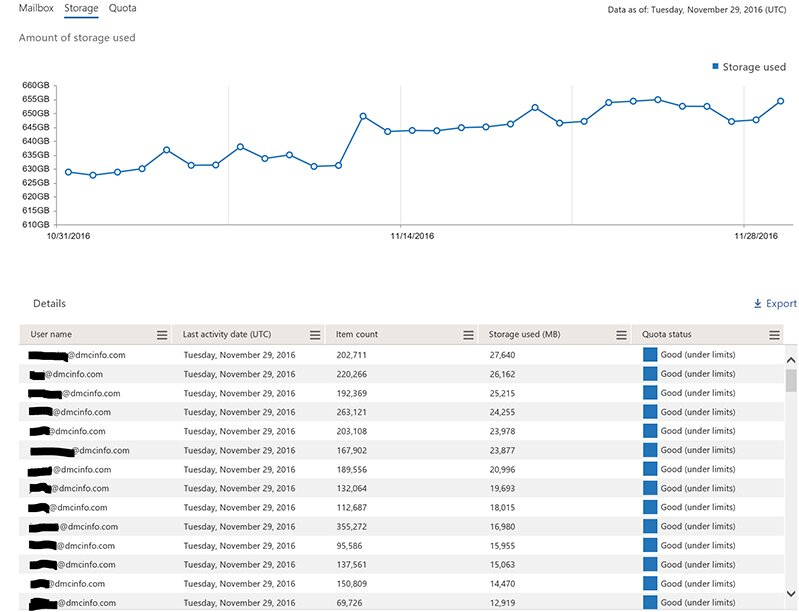
Exchange Online Storage Report
This report was recently added to the new reporting with major upgrades. It displays the overall storage used for the entire O365 Exchange Online tenant and each user in sortable columns by the number of emails and storage used. I can now quickly identify who is in good standing in regards to that user’s 50 GB quota and perhaps set up archiving or share some email best practices with that user.
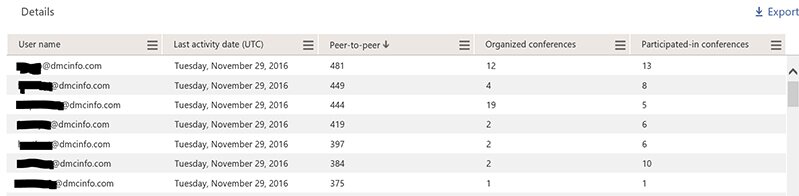
Skype for Business Activity Report
While I admit, this report is more of a curiosity type report, it is interesting to see who is a heavy user of Skype’s IM feature.
Security & Compliance Reporting
Microsoft has stepped up their game in an area that I think a majority of IT directors worry about the most when considering all the data that lives in the cloud.
Security reporting helps IT Admins find out who has access to things they shouldn’t, detected malware & spam sent/received, what rules have been deployed/used and whether or what mailboxes have been placed on any type of hold. These are the reports I find the most valuable, but there certainly are others as you can see again in the image below.
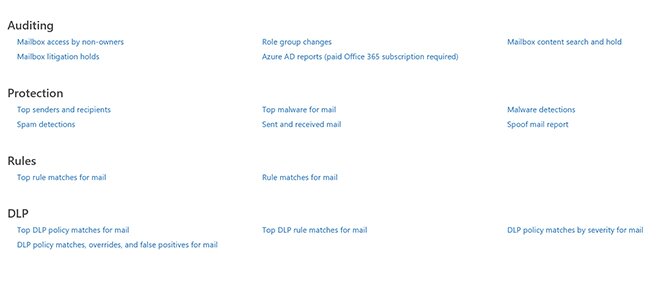
With each of these reports, you can change the date filter or even use a custom range.
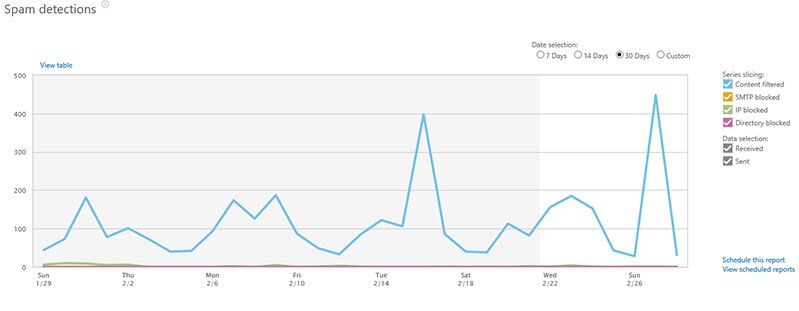
SPAM Detection
Looking specifically at the SPAM detection reports over the course of 30 days, you can see the spikes throughout and see which days SPAM was received at a faster rate.
A new feature is the ability to click a data point on the graph (within the last 7 days) and get a detailed report that includes the emails themselves that were classified as SPAM.
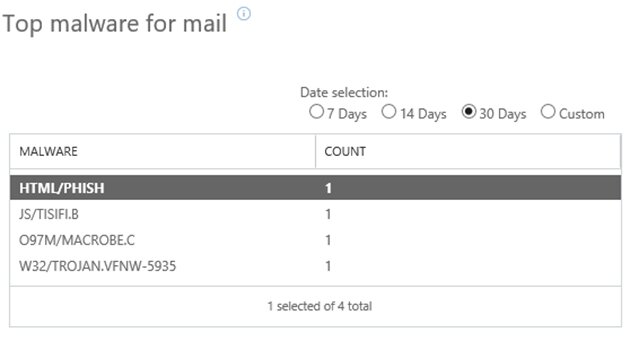
Malware Report
The same applies to the Malware report. This is helpful for figuring out not only when it was sent but from what source.
Below is the Top Malware for mail report that shows which specific malware was detected.
Conclusions
Now that the new admin center has been available for most O365 tenants for the better part of a year, Microsoft has done a fantastic job improving the reporting. All reports that were in the old admin center are still there, and Administrators now have an easy way to take a granular look at the data they care most about.
Improvements seem to come in weekly, so stay tuned for further improvements to not only the reporting area but also to the entire admin center itself.
DMC monitors the Office 365 environments for many clients to detect abnormalities and prepare monthly health assessments using this data. Reach out to us if you need any health monitoring/recommendations on best practices for your Office 365 or Azure environments.
Learn more about DMC's Microsoft Office 365 services.