Report Builder is a powerful tool that allows users to design reports which can connect to and pull data from a Microsoft SQL server. When a user designs a report, they create a report definition language (.rdl) file which is not a report in and of itself. Rather, the .rdl file establishes a modular template which defines what the report should look like.
Running the report populates it with data from the SQL server and the resulting file can be saved as a PDF, CSV, or DOC file. Report running can be done in numerous ways, such as: manually through Report Builder, from a SQL Server Reporting Services (SSRS) web portal either manually or through an automated schedule or external scripting tools. Uploading a .rdl file to an SSRS server and generating reports is outside the scope of this blog post but will be included in a future one!
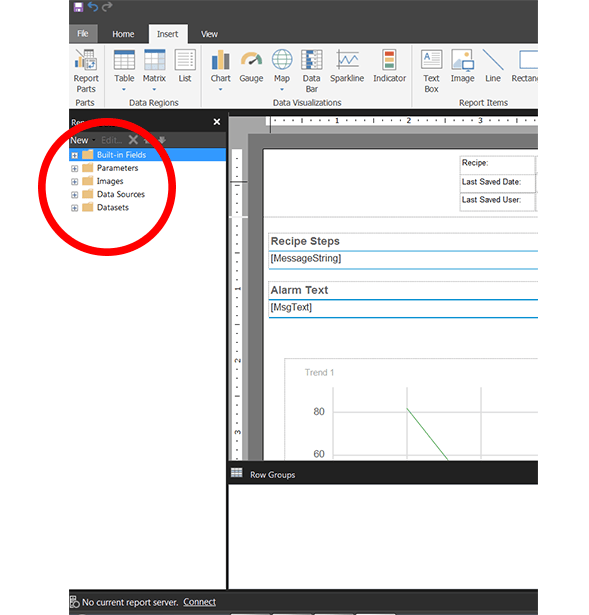
Report Data
The Report Data pane lives on the left-hand side of the Report Builder window and consists of 5 sections: Built-in Fields, Parameters, Images, Data Sources, and Datasets.
Built-In Fields
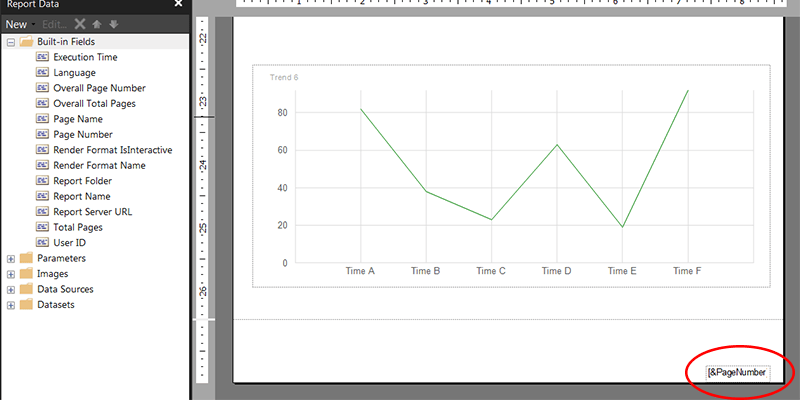
The Built-in Fields are objects which can be placed into the report that contain metadata about the report, such as the page number of the current page, the name of the report, or the total number of pages in the report. The screenshot below shows the Page Number built-in field in the footer of the report so that each page in the report displays its page number in the bottom right-hand corner. I give further instructions on creating a header or footer later in this blog. To insert the Page Number built-in field into the report, simply drag it from the Report Data pane into the report.
Parameters
Parameters are user-defined variables that are required as input when a report is run. Typically, these are used to create filters for data or to allow the user running the report to enter information for the report, such as a batch name. In the example shown in the screenshot, we have created a parameter called “From” with data type “Date/Time” which will be used in conjunction with a parameter called “To” to allow the user to select a date range within which the report will display data.
To create a new parameter right click on the Parameters folder and select “Add Parameter…” and the properties window shown in the screenshot will appear.
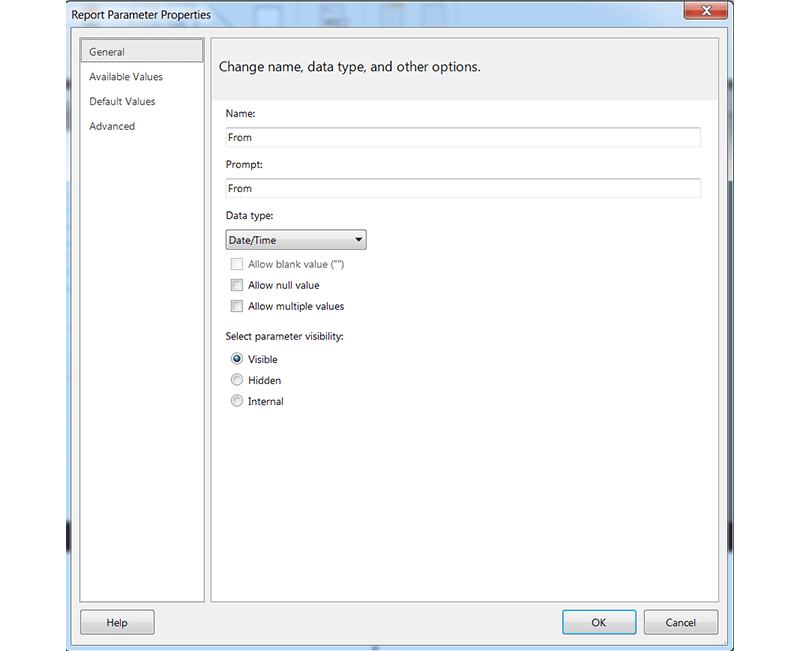
The “Name” field in the properties is how the parameter will be referred to within the report builder, while the “Prompt” field is the prompt that will appear to the user who runs the report. In this case, we have them both set to the same thing, but we could make the Prompt instead “Select a start date,” for example.
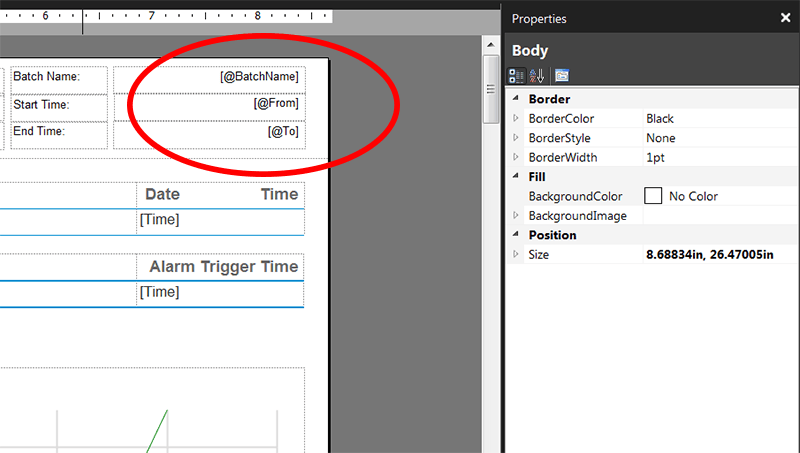
Once defined, parameters may be dragged into the report to display just like built-in fields. In the screenshot, we have three parameters, Batch Name, From, and To, that are all presented within the header of the report so that each page of the generated report will show the details of the run that the report was generated for.
Images
The Images section allows the user to, unsurprisingly, upload an image file (JPEG, GIF, PNG, or BMP) which can then be embedded within the report. The user can, for example, upload their company logo to place in the header of the report.
Data Sources
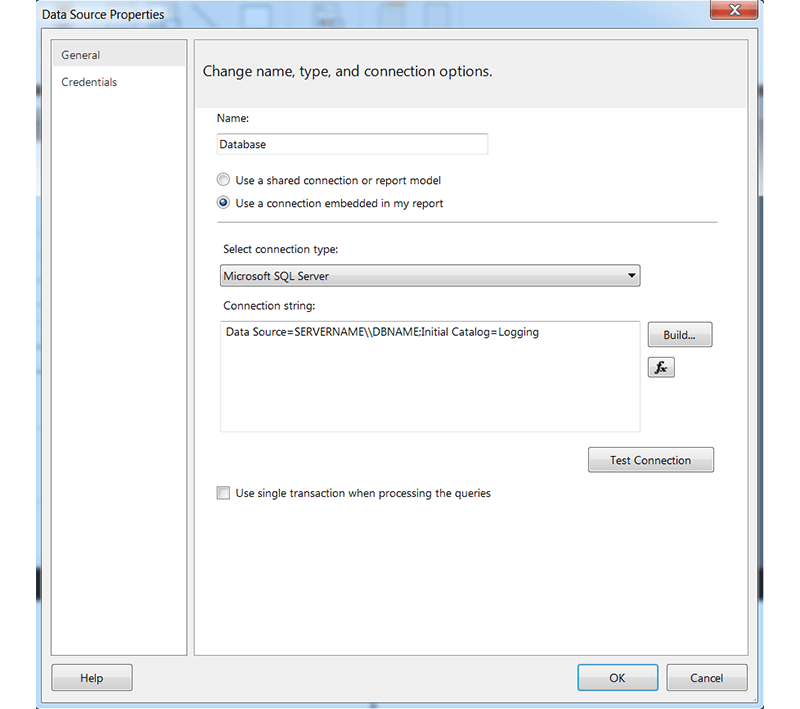
The Data Sources section allows the user to specify a connection to a database. Data sources are a critically important component, as all the data that will populate the report must come through a database connection. When the user adds a new data source, the data source properties window, shown in the screenshot, appears and allows the user to specify a name for the data source, the type of connection, and to create a connection string. The “Build…” button launches a useful tool that assists the user in creating the connection string, and the “Test Connection” button can be used to verify that the connection string is correct. Multiple data sources may be configured within a single report.
Datasets
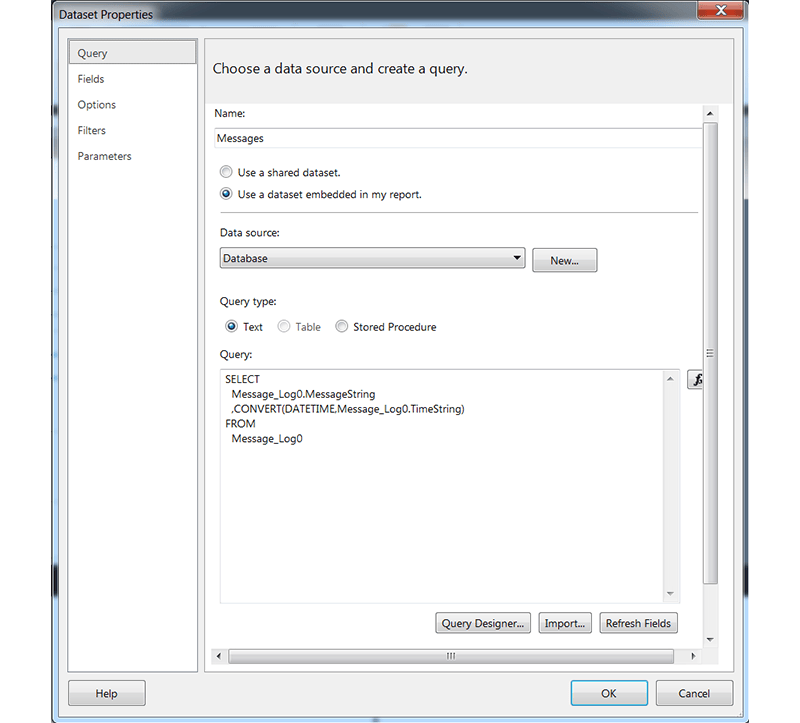
Once a data source has been configured, datasets may be created. Datasets correspond to table queries within a database. When the user adds a new dataset, the dataset properties window, shown in the screenshot, appears and allows the user to link the dataset to a data source and build a query to extract data from the data source.
The “fx” button brings up an interface to assist with query creation and the “Query Designer…” button launches a tool which connects to the data source and allows the user to design queries. Existing queries may be imported through the “Import…” button.
In the left-hand bar, filtering can set up to reduce the amount of data brought into the report. In the picture below, the query is designed to pull data from a table named Message_Log0 consisting of a MessageString and TimeString and convert the TimeString into the DateTime data type. Once the dataset is created, those two fields will be available to use within the report.
Report Elements
There are numerous elements which can be added to a report. The list below is by no means comprehensive. Instead, it just touches on a few of the most commonly used report components that help display and visualize the data from the Report Data section above. Other types of report elements include gauges, maps, lists, and indicators.
Tables
Tables can be found under the “Insert” tab at the top level of the Report Builder window and can be either inserted directly into the report or configured through the table wizard. The table wizard is a useful tool to assist the user in selecting a dataset, choosing which fields to display from the dataset, and organizing the displayed fields within the table.
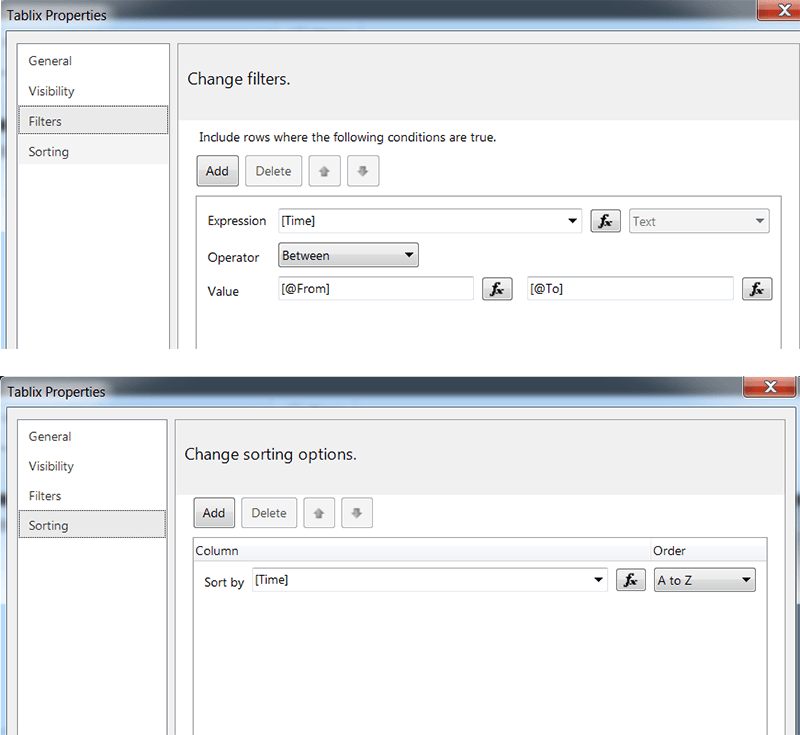
However, the table wizard cannot be used to customize the appearance of the table. Instead, once the table is created, its appearance can be modified through the Properties pane in the right-hand side of the Report Builder window. Additional tools like filtering of the data within the table and sorting of the data within the table can be accessed through the Tablix Properties, which may be found by right-clicking on the table. Once a table is created, additional columns can be added by simply dragging the desired dataset field into the table from the Report Data pane.
In the example below, the user has created a dataset with two fields, “MsgText” and “Time” and is setting up a table with those two fields as the two columns. The first screenshot below shows the table “Filters” property configured such that the table only displays rows with a [Time] field from the dataset between the “From” and “To” parameters set up above. The second screenshot below shows the table “Sorting” property configured such that the values displayed in the table are sorted by the [Time] field from the dataset.
Charts
Similarly to tables, charts may be created through the Insert tab either manually or through the Chart Wizard. There are numerous chart types, from column and line to scatter and polar. The chart wizard is a useful tool to assist the user in selecting a dataset, choosing which fields to display from the dataset, and linking axis labels to fields from the data set.
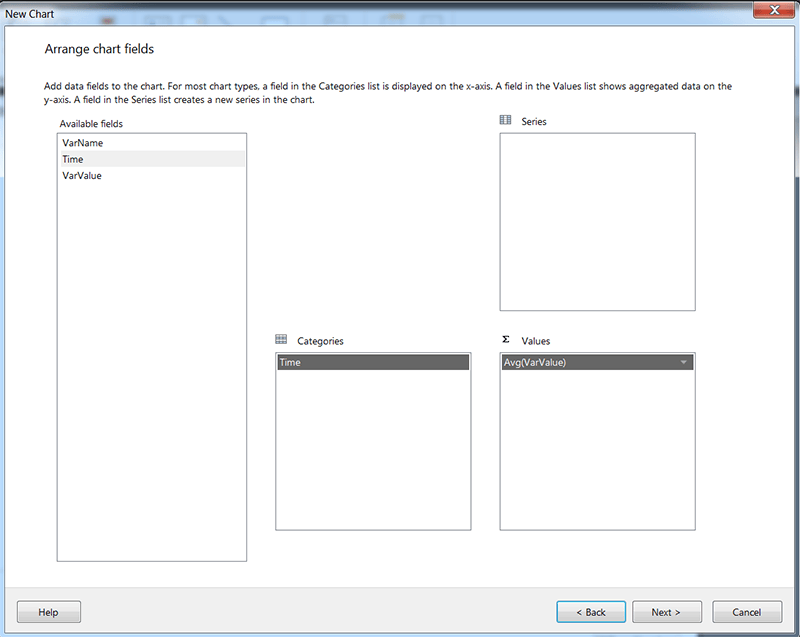
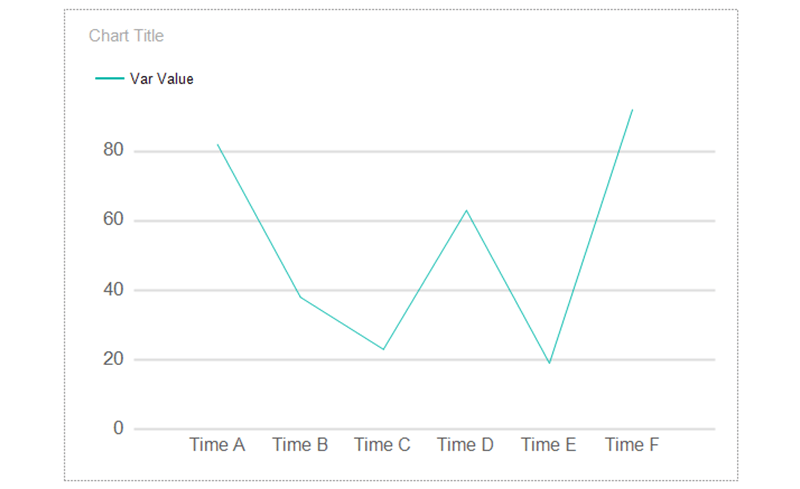
When using the chart wizard, it is useful to note that Report Builder refers to the x-axis as the “Category” and the y-axis as the “Value”. So, if a user were to have time series data from a SQL table comprising timestamps (“Time”) and values (“VarValue”), the Time fields would be placed in the Categories section while the VarValue fields would be placed in the Values section, as shown in the screenshot.
The resulting chart based on those field assignments would look like the below screenshot. Any of the fields displayed on the chart can be edited simply by right-clicking on them, like the chart title, x-axis, y-axis, legend, and chart area.
Headers & Footers
Headers and Footers may be added to a report by using the Insert tab in the top menu of the Report Builder window. Once a header or footer has been created, its height, border properties, and display settings may be modified by right-clicking on it to access its properties pane.
Two Notes About Formatting
The Properties Pane
The properties pane allows the user to control the appearance and layout of report elements easily. Appearance properties like the border, fill, and alignment, as well as behavioral properties like empty data handling, visibility, and page break handling, can all be modified in the properties pane when a report element is selected.
Page Width
The page width is controllable through the properties pane of the body of the report and is an important factor when generating PDF reports. If the page width is too small to fit the contents of the report as well as the spacing for the margins, then the PDF will be generated with undesired blank pages that the report generator includes accounting for the “spillover.” A good rule of thumb for avoiding this issue is to follow the formula (Body Width+Left Margin+Right Margin)<(Page Width-1cm).
The margin sizes can be found and modified in the properties pane of the report itself, which may be accessed by simply clicking on the grey area around the report with the properties pane open.
If issues with blank pages being inserted into PDFs persist after correctly setting up the page width a further option is to set the “ConsumeContainerWhitespace” property to “True.” That property may be found in the properties pane of the report as well, under the section labeled “Other.”
There are many more tools and features built into Report Builder, but this should be enough to get started putting together a basic report. For a more in-depth tutorial and examples, check out the Microsoft documentation.
Learn more about DMC's Manufacturing Automation and Intelligence Services.
Learn more about DMC's Application Development Services.