One of the most common complaints regarding the capabilities of Power BI and other reporting platforms at large is the ability, or lack thereof, to easily roll up data by month. Power BI, by default, has some capability to do this in the form of date hierarchies.
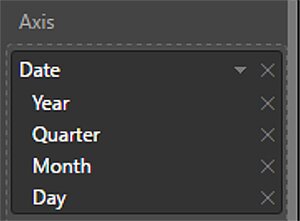
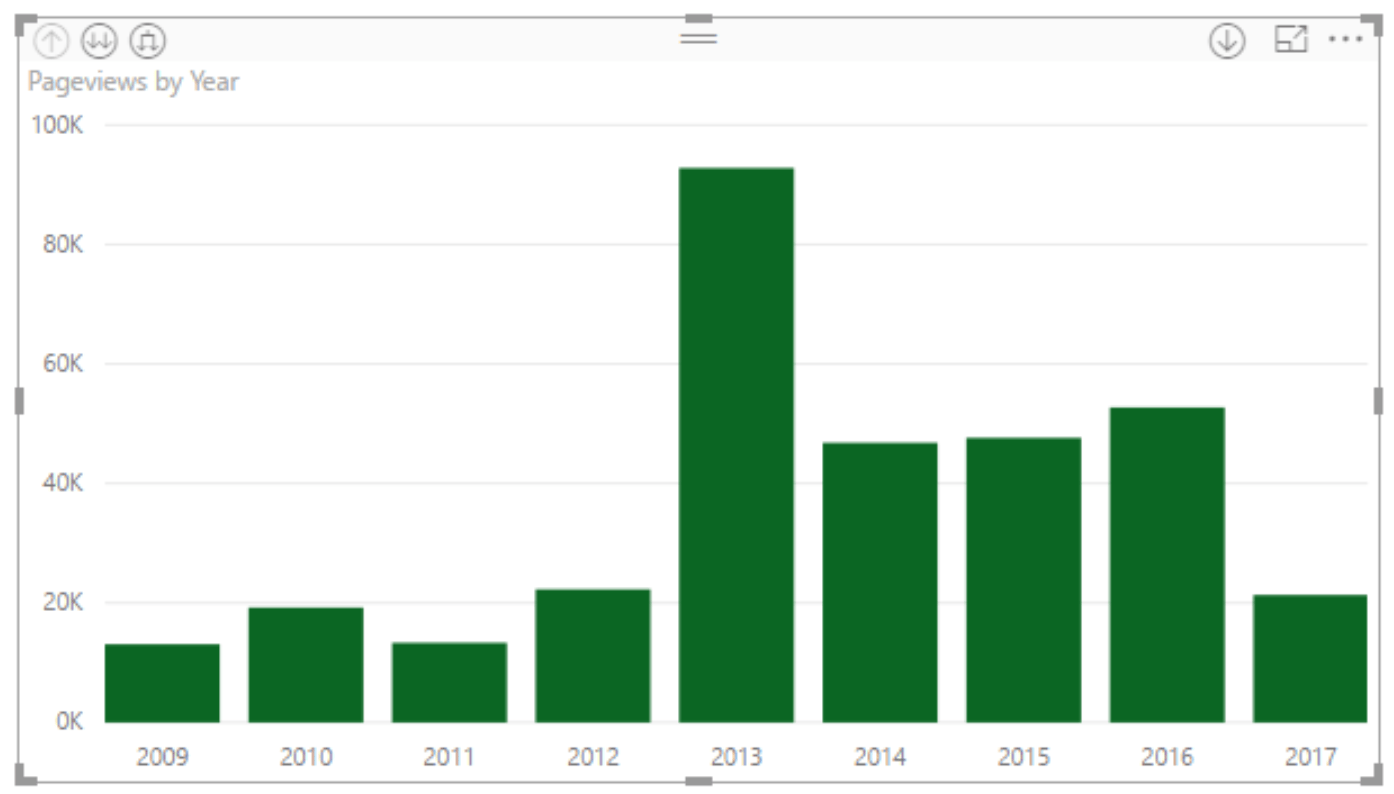
When you select a DateTime field as a dimension in a Power BI visualization, Power BI utilizes date hierarchies by default. This rolls up the measures to the year level and then enables drill-downs into each quarter, month, week, and day.
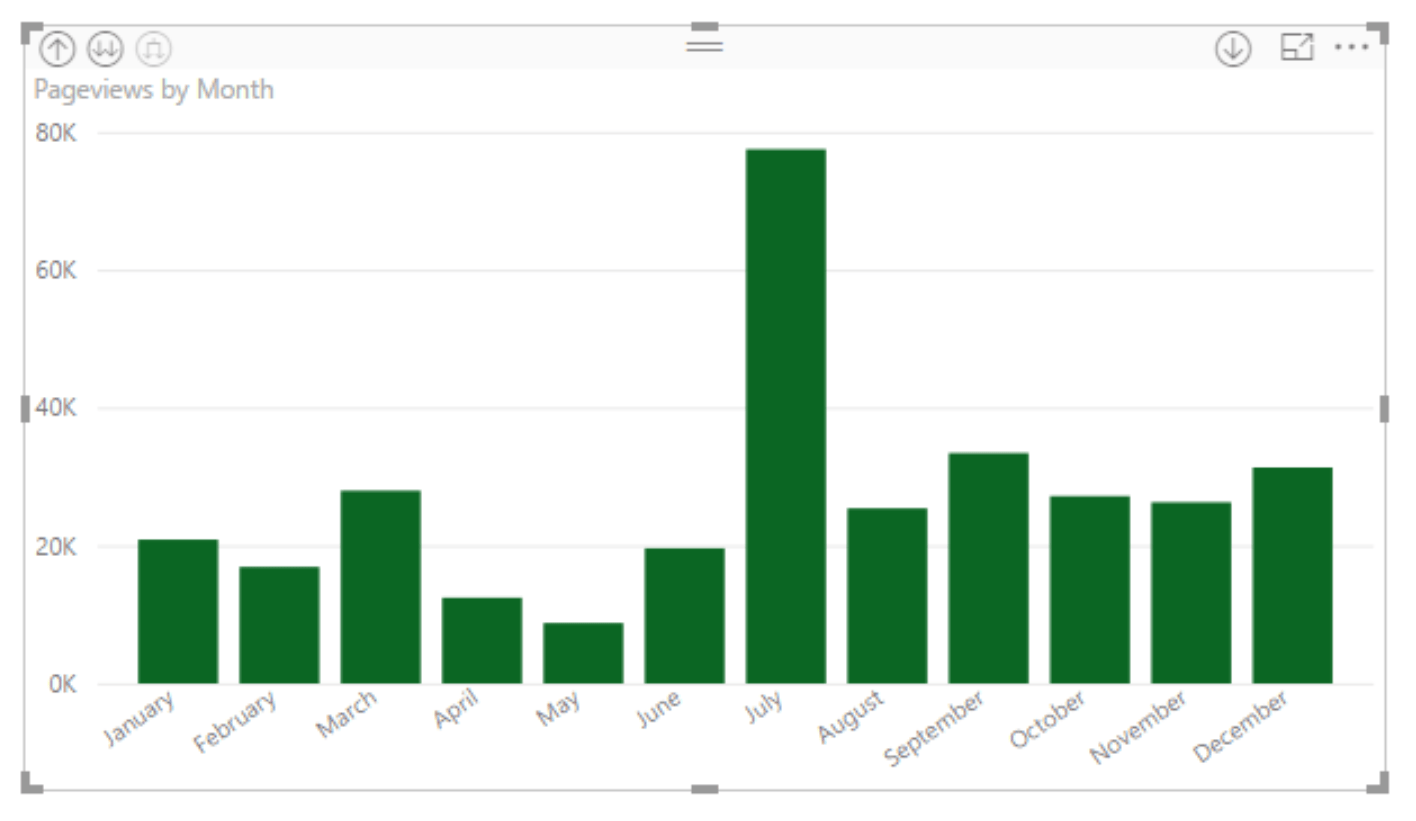
However, this does not allow us to see, for example, sales by month for the last two years. Instead, we can see data by year or data by month (combining the previous and current year’s January data into a single January data point). This is valuable in some cases, such as evaluating seasonal trends using multiple year’s data, but is not valuable for seeing a trend line.
Date Tables - The Rundown
There are several ways to get the data in the form we need, but the best practice is to create a Date Table.
A Date Table is a standalone table, that can be used in any data model, which interprets dates into their constituent parts.
For example, a Date Table always has a date field but often has Month, Day, Day of the Week, a combination of the year and month (2016-04 for example), Quarters, fiscal years, and any number of other ways a date can be sliced and diced. Once it is imported, simply create a relationship between the timestamp in your fact table and the primary key of the Date Table.
Now you can use any of these additional fields to show your data by month and year, or even by day of the week. For example:
First of Month = DATE(YEAR([Date]), Month([Date]), 1)
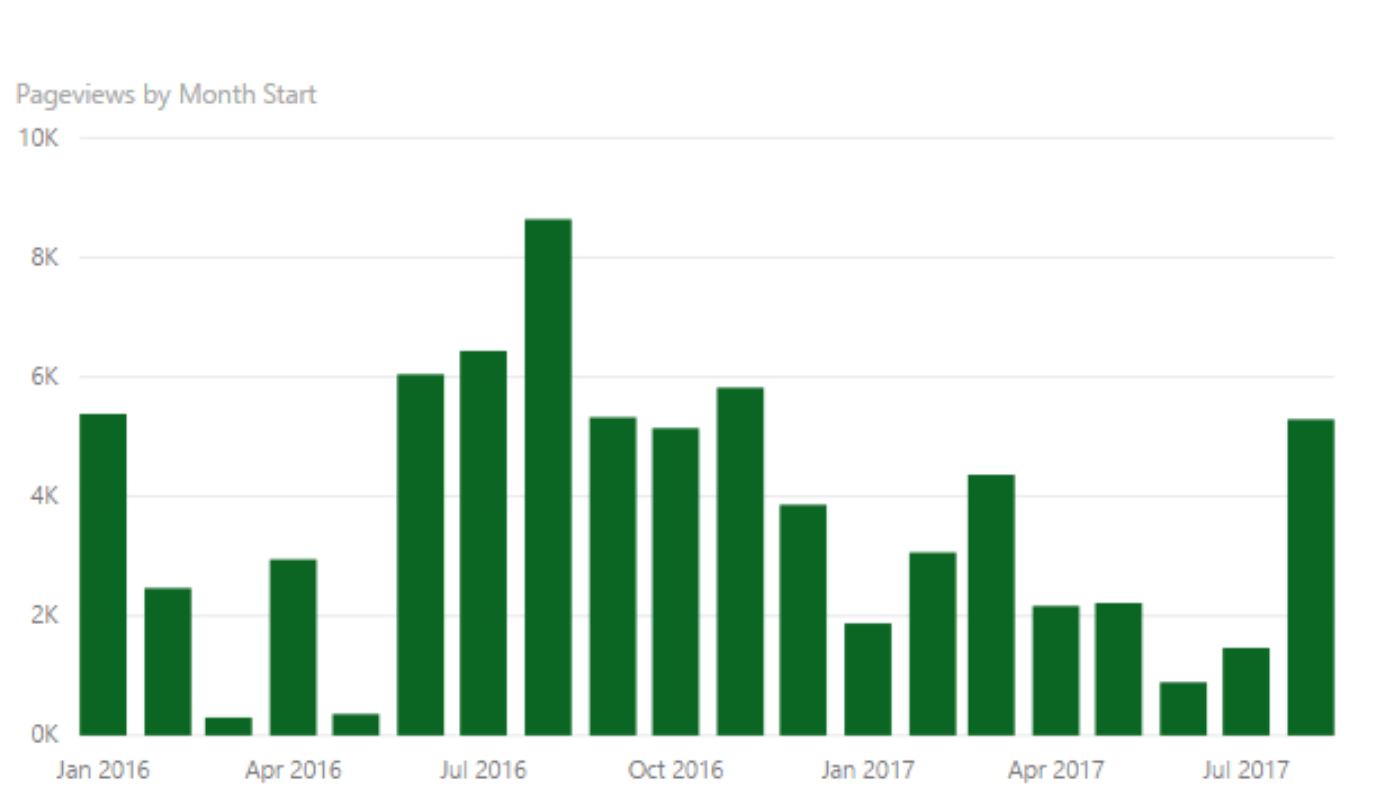
In the example we are using, I want to see sales data by month for the last two years, so instead of using the date field as my x-axis, I use the First Of Month as my axis. This has the effect of showing me all of the measures grouped by year and by month.
The best part about creating a Date Table is that anyone can then use it, and you can re-use it as many times as you like. This is great for a company with a non-standard fiscal year or even week structure. You can share it as a data source or even host it in a database for others in your organization to use.
Date Tables - Don't Forget...
There are a few things to remember when using a date table.
- Filter your Date Table to only bring in data within the range of your data. Most Date Tables contain dates starting from decades ago to decades in the future. For a relational database this is fine, but in Power BI where size restrictions matter, it’s good to filter your data to only relevant time periods.
- If your data is time-stamped, you may need to create a separate column in your fact table which contains a time-stamp-free version of the date to join with your Date Table.
- Feel free to add as many fields as you like; every company does calendars slightly differently. Consider adding holiday designations, fiscal year designations, or non-standard date fields like “peak months” to help you analyze your data.
- You can also use the DAX function CALENDAR(<Min Date>, <Max Date>) when creating a new table from a formula to get a date range between the two dates. For example TableName = CALENDAR("1/1/2017", "12/31/2017") would create a table with 365 rows and 1 column Date. From there you can add your other columns as necessary.
Learn about DMC's Business Intelligence services or Contact Us to get started on a solution today.
Check out this practice in action on DMC's Power BI Showcase.