Today, I want to detail a couple of cool tricks to use Segger Real Time Transfer with an EFM32 to create an easy-to-view trace log. Segger Real Time Transfer, or RTT for short, is a debugging interface designed specifically around the J-Links capabilities to provide an extremely efficient debug message input and output interface.
This is accomplished by writing messages to a RAM buffer on the microcontroller that the J-Link is capable of reading through the standard ARM debug interface. This means that RTT requires a low-performance overhead (essentially a memcopy) and does not interfere with the execution of a user program. Additional details about implementation and performance can be found on SEGGER’s website.
Project Integration
In order to integrate RTT into a project, you simply need to copy the relevant source files and include them in your project. These files can be found in the J-Link Software and Documentation Pack under Samples\RTT\RTT. At a minimum, the following files are required:
- SEGGER_RTT.h
- SEGGER_RTT.c
- SEGGER_RTT _Conf.c
Optionally, a user can include:
- SEGGER_RTT _printf.c (adds lightweight printf support to protocol)
- SEGGER_RTT_syscalls_X.c (overrides system calls for X compiler)
Once copied into the project, you can configure the system for your specific use case, or leave it to its defaults and simply use the standard SEGGER_RTT_Read(), SEGGER_RTT_Write(), and SEGGER_RTT_printf() functions. There are several configuration options and additional features available that are out of the scope of this article and are well documented on SEGGER’s website and in the source files.
Running RTT Terminal
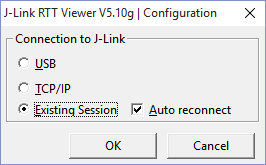
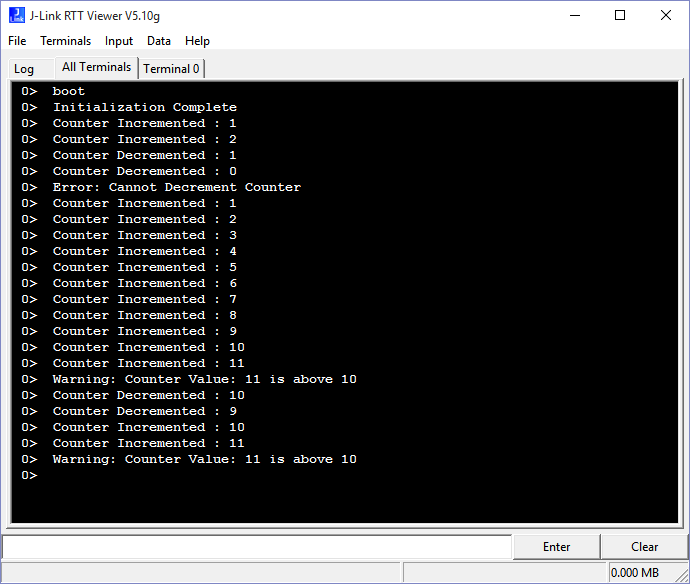
Your debug outputs can be viewed in several ways once your code is compiled and running. The simplest way is to open the J-Link RTT Viewer application installed on your computer and select Existing Session. This will connect you to your current active debug session and begin collecting messages.
Note: For EFM32 kits, you must start the RTTViewer prior to initiating a debug session
Logging with RealTerm
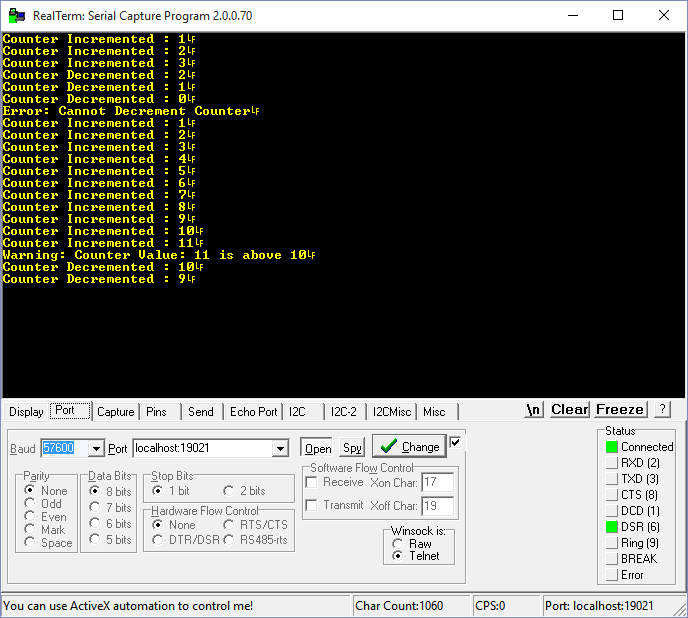
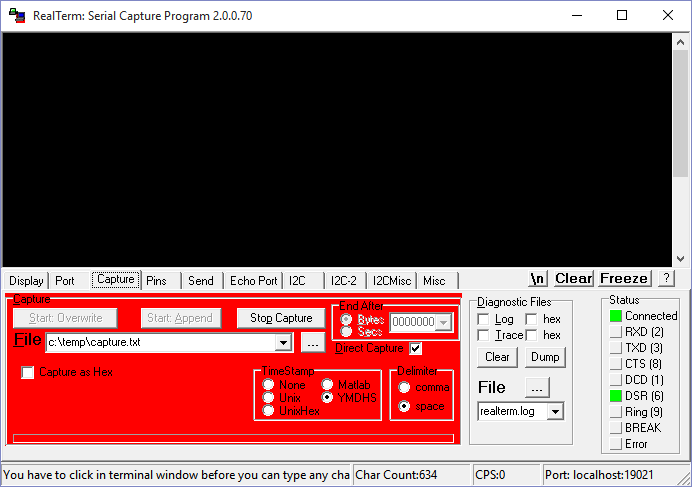
Once you have the RTT viewer displaying messages, the next step is to log those messages to a file. We are going to accomplish this by utilizing RTT’s available telnet connection. You can connect a Telnet client to localhost:19021 whenever RTT is running. In this case, we will use the application RealTerm, which can be found here. Once RealTerm is installed, open it, connect to localhost:19021, and then begin capturing information to a log file.
Note: Depending on the debugger and IDE used, RTT may not start on its own, and you will need to open the RTT Viewer application prior to connecting over Telnet.
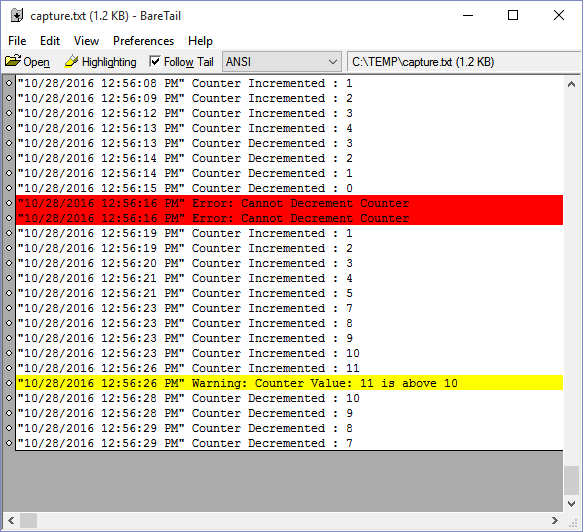
Viewing with Baretail
The last trick I want to show off is the ability to view the above log files in real-time. This can be done using the application BareTail found here. BareTail allows you to view text files in real-time as they are being edited and also highlight specific messages or characters.
Comparison to UART and J-Link debugger
Finally, we can compare the use of RTT to other standard debugging practices such as a dedicated UART or debugging with breakpoints by looking at each option's pros.
Segger RTT:
- Low overhead
- No additional pins/connections to MCU
- Simple to implement
- Doesn’t alter program flow
Dedicated UART:
- Doesn’t require an exposed debug connection and J-link hardware
- Doesn’t alter program flow
Breakpoints:
- No additional pins/connections to MCU
- Provides complete information (call stack, variable values, execution order)
Learn more about DMC’s Embedded Development and Programming expertise.