Power BI is a fantastic tool for creating visually appealing reports to analyze numerous sources of data. Report creation is often as simple as dragging and dropping if the data available is appropriately formatted. However, this is not always the case. Fortunately, Power BI contains a powerful Query Editor that allows you to transform your data into exactly the form you need. Below is a list of features that can make life easier!
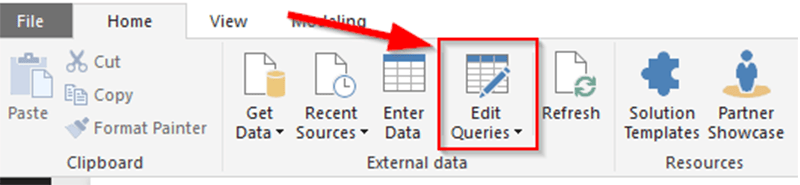
To access the query editor, navigate to the home tab, and click on Edit Queries in the External Data section.
Renaming Columns
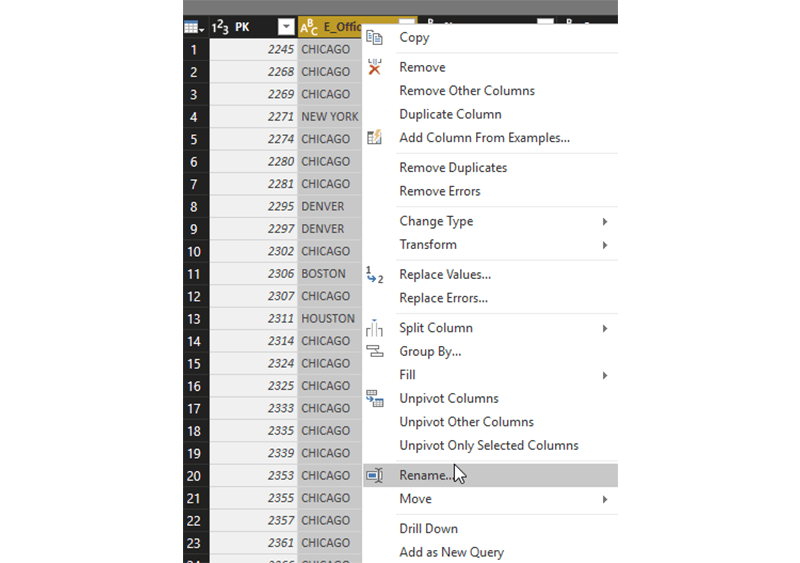
Renaming columns in Power BI is a best practice, as it makes working with the dataset easier. Many database columns often have longer names that only make sense within the context of the database. If so, right click on the column header, select Rename, and type in a user-friendly title! There is also a rename option under the Transform tab in the Any Column section.
Creating a Custom Column
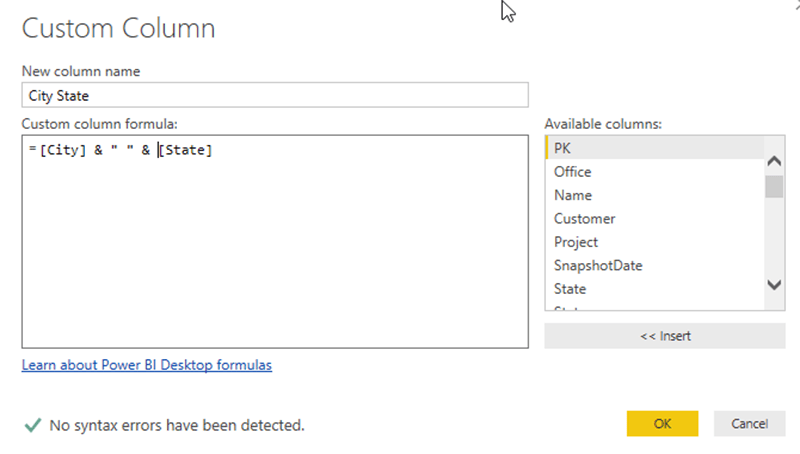
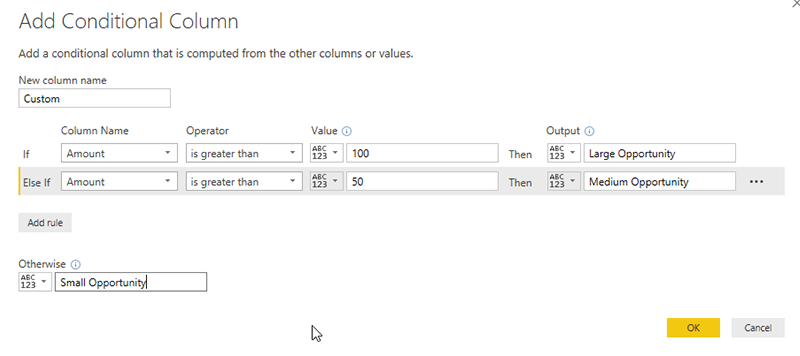
If the data points aren’t in the exact format required, creating a custom column is a great option. With this feature, you can combine columns into one, and even conditionally create new ones based on data values. For instance, below I am combining the City and State columns into one. In the second image, I am creating a column that classifies the data point as either “Large Opportunity,” “Medium Opportunity,” or “Small Opportunity” based on its amount value. To access these features, click on the Add Column tab along the top menu, and create the column that best fits your needs.
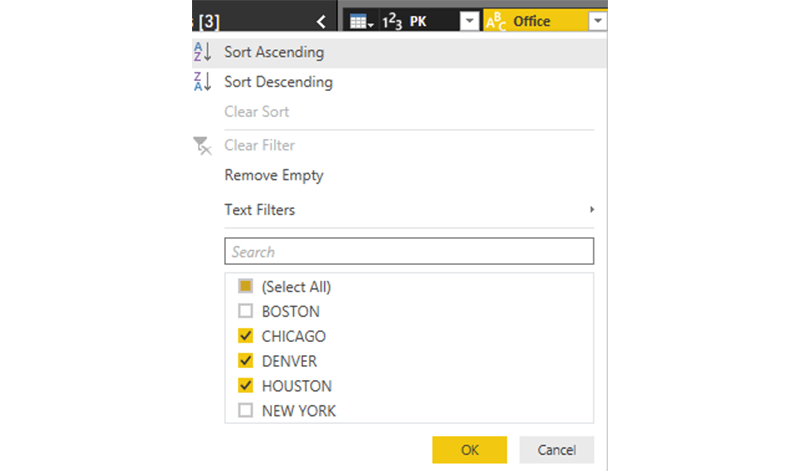
Filtering Data
Depending on your needs, there may be data points that are irrelevant to the dashboard you are creating. Rather than filter them out on each visual, the Query Editor can filter them out as soon as the data gets to Power BI. Click on the arrow by the column header, and deselect the options that are not applicable to your situation.
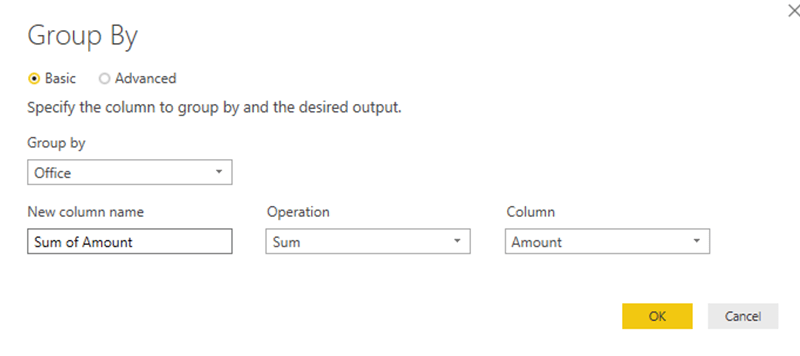
Grouping Data
While Power BI is smart enough to group data in visuals across aggregations like Sum, Average, and Maximum, the Query Editor provides an option to group the data explicitly. Simply select the grouping column, and the aggregation details and the data will group as expected.
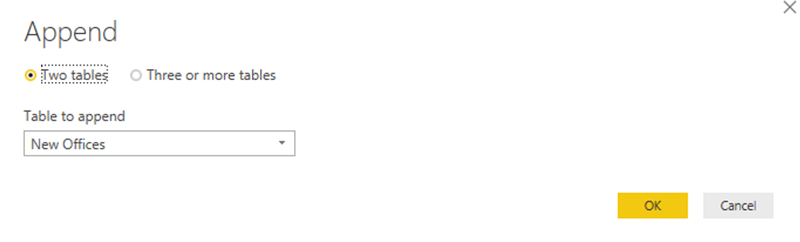
Combining Datasets
If you are pulling in similar data from multiple sources, Power BI allows you to append the tables together easily. If the tables already have the same columns, and you’re looking to operate similar SQL’s Union, you can use the append feature, seen below. If you are trying to imitate SQL’s Join, the Query Editor has an option to Merge Queries, which will work just as a Join operation would.
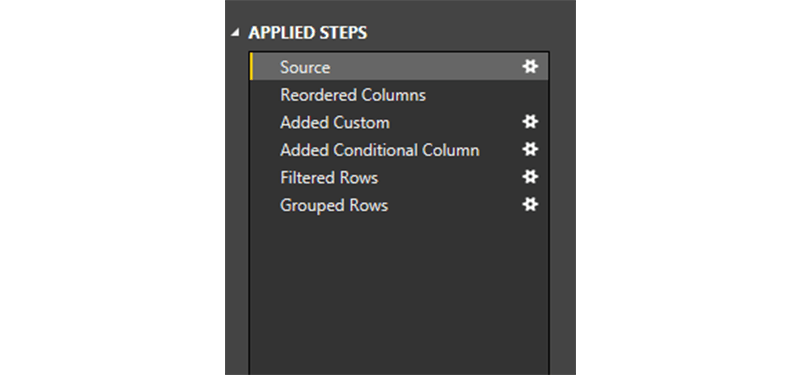
Pulling it all Together
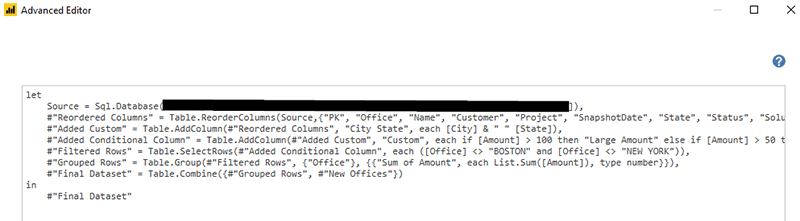
As you perform each one of these steps, Power BI tracks the exact changes you’ve made. You can see these changes queuing on the left of the Query Editor. If you are a more technical user, you can also view all these query modifications in the advanced editor, where you can make modifications by changing the text of the query steps themselves.
After you’ve applied all your data transformations, you’ll have a dataset ready to be morphed into a shiny dashboard!
Learn more about DMC’s Business Intelligence services.