An essential part of the development process for embedded devices is debugger logging. With multiple threads running simultaneously on a resource-constrained microcontroller, it can be hard to know where to start debugging.
Putting debugger breakpoints has been a general approach to debugging firmware as it allows engineers to view variable values and investigate the call stack; however, this interrupts the program flow, and, with multiple threads running at the same time, this can cause unexpected code behavior issues.
In cases where I have embedded devices in communication with each other or with an external PC application, I have found myself resorting to logging to debug code behavior. The tools that I have found helpful are RealTerm for capturing log entries and BareTail / Notepad++ for viewing log entries.
Prerequisites: The firmware, either custom or open-source libraries, should have been configured with debugging/logging output. If you need to add debugging output to your program, check out our Using Segger Real Time Transfer with an EFM32 blog for an example!
Tool 1 – RealTerm
RealTerm is a terminal program for serial communication and is one of the most frequently used tools in the embedded team at DMC to capture data transmission through various protocols (e.g. UART).
- In the Port tab, select the baud rate and COM port for the debugger output. You can check which port your debugger is attached to using Device Manager. Hit “Open” to connect to the port, and you should start seeing some logging statements in the display window.
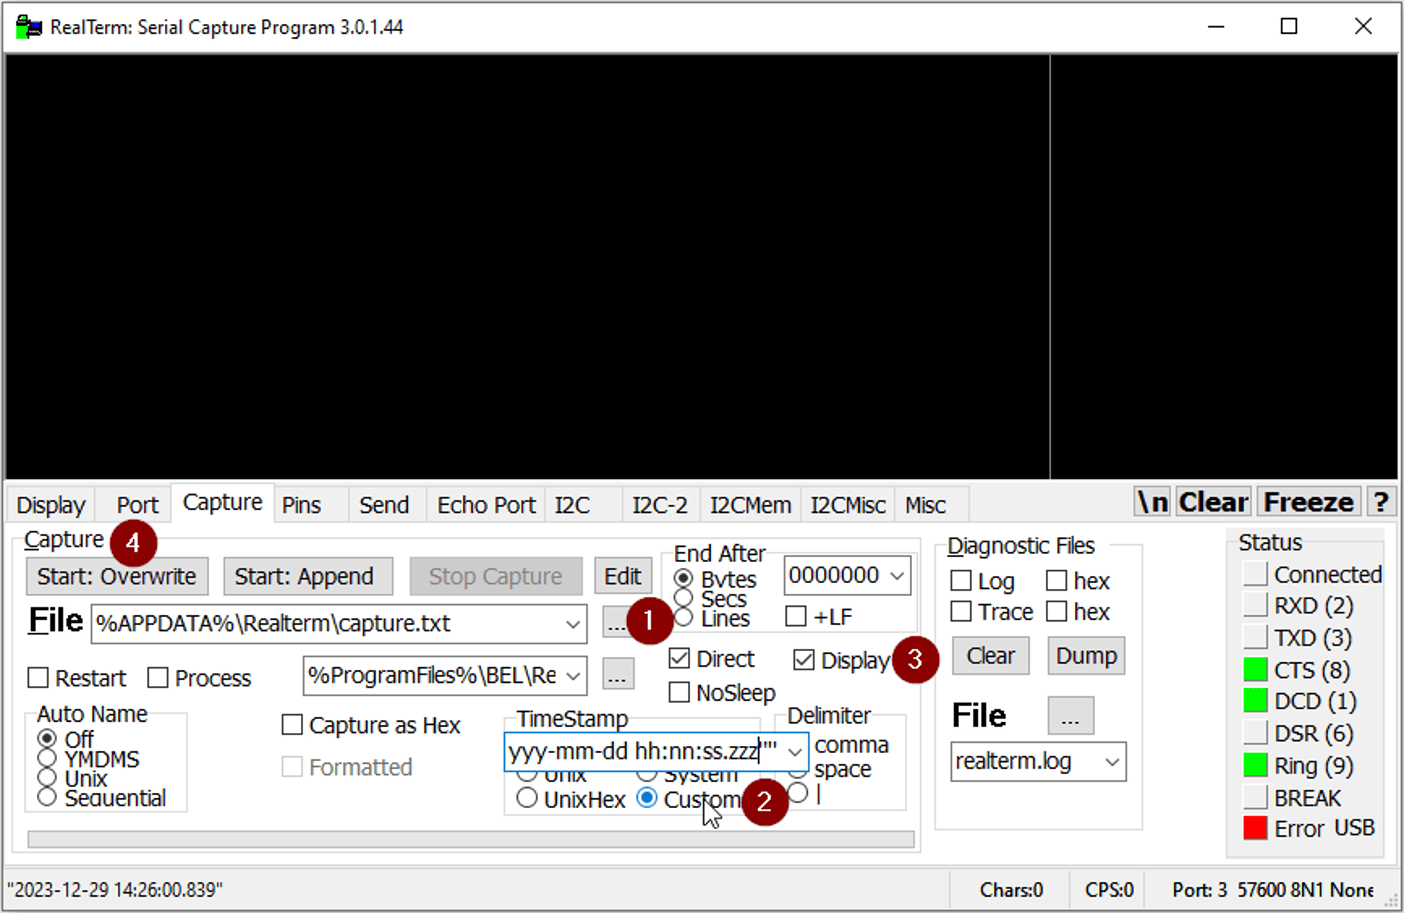
- To capture the logging statements in a file, navigate to the Capture tab and select “…” to name the file and pick its location. You can then click “Start: Overwrite” to route the logging statements to the file; however, I always default to clicking “Custom” in the Timestamp section to add timestamps to the logs. A trick I use often is right clicking on the “Custom” option to add “.zzz” to the current format to display milliseconds in the timestamp. I also like checking off the “Display” option just to have the logging statements show up in the display window as well.
Tool 2 Option 1 – BareTail
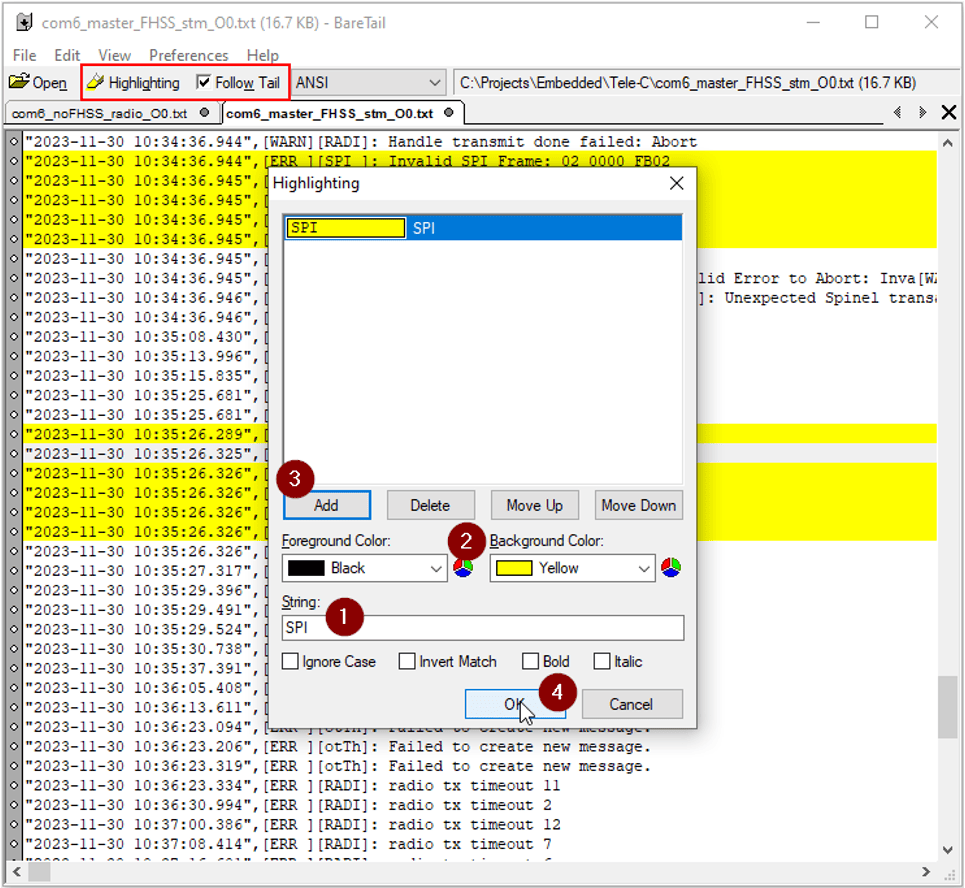
BareTail is a real-time log file monitoring tool that allows users to view log file changes live as they are being written and works well in conjunction with RealTerm. Its “Highlight” feature is particularly helpful for identifying log statements of interest as users can color code log entries based on keywords.
- Launch BareTail. Open the log file. You should see log statements being written to the end of the file in real time. The “Follow Tail” checkbox indicates if the view follows the log changes at the end of the file. If you use the scroll bar to scroll up or disable the “Follow Tail” checkbox, the view will stop following the end of the file, but new log statements are still constantly being written to the file.
- If you want to color code certain log entries, click “Highlighting.” In the popup window, enter the text of interest and select the font and/or background color. Click “Add” to see how the log file will look and “OK” to apply the color-coding rule.
Note that BareTail is not like any text editor tool in that it does not allow users to edit the log file, which seems reasonable since we do not want to mess with the log when we are trying to analyze the content! It also does not have Search or Filter capabilities. Its Highlight feature aims to point out important log statements and somehow replaces the need for search and filter.
Tool 2 Option 2 – Notepad++
If you find yourself needing to edit or search within a log file, you may want to use Notepad++ in replacement of BareTail. Notepad++, by the name, is an upgraded version of Notepad and a powerful free source code editor that supports various languages. In addition to its extensible range of editor features, it has an “eyeball” icon that allows users to track log file changes in real-time.
- Launch Notepad++ and open the log file. The current content of the file is statically shown up to the time point when the file is being opened.
- To view real-time file logging, click on the “eyeball” icon and you should see log entries being written to the end of the file. Toggling the icon will switch between real-time logging and static modes. Note that, unlike in BareTail, you can’t scroll up the file to view previous entries while new entries are being logged. You will need to disable the “eyeball” icon to stop the logging to scroll up, analyze your log, or make any edits. If you want an updated view of the log, you can enable the “eyeball” icon again.
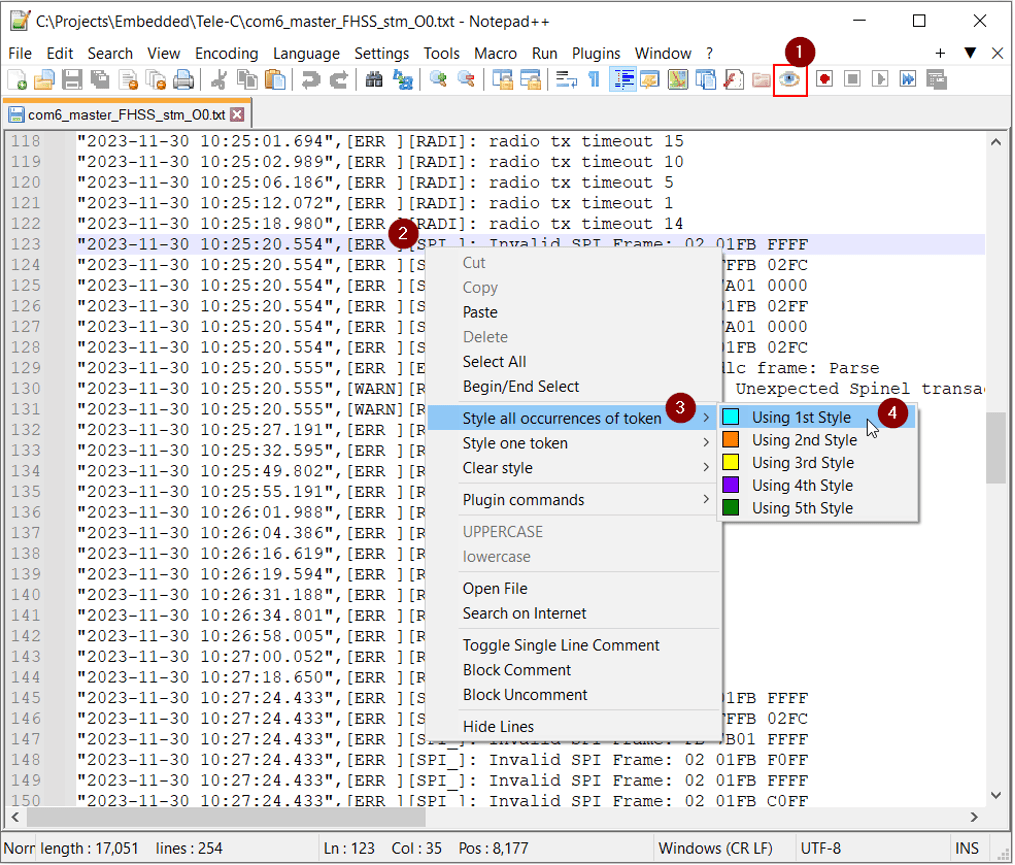
- There are two ways to highlight log entries based on keywords. Unlike in BareTail, only the keywords are highlighted instead of the entire log entries.
- You can select a keyword in the file, right click to select “Style all occurrences of token” and pick a color/style to apply.
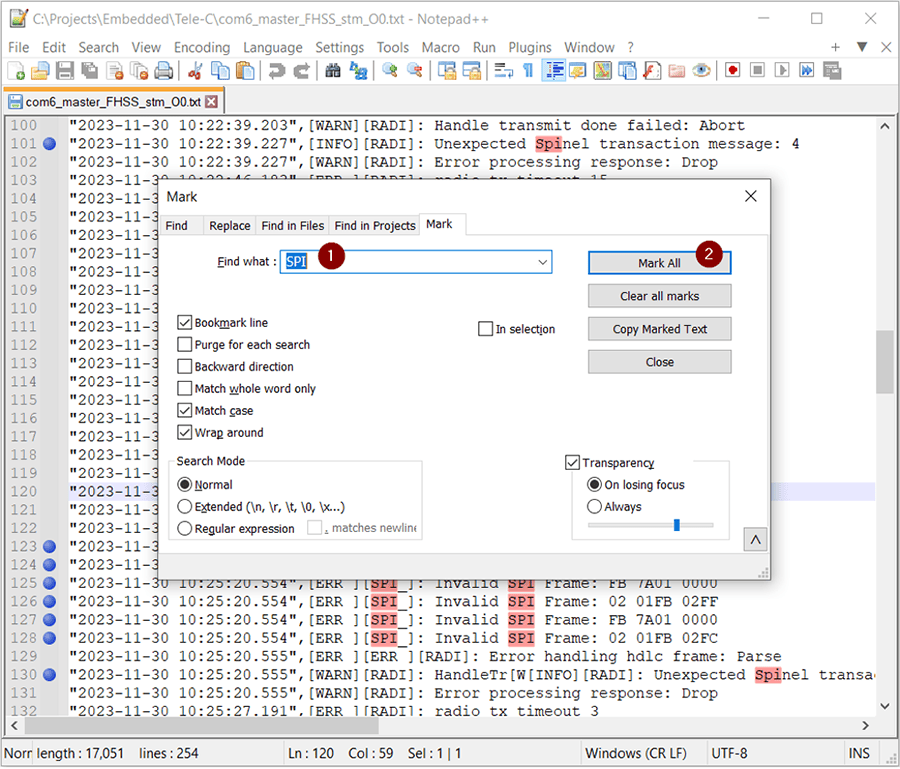
- You can also go to Search > Mark to type in the keyword and click “Mark All.” This approach does not provide different color options to pick from; however, it has more complicated search features, e.g. using regular expressions. It also has a neat “Bookmark line” option that adds bookmarks to any line that contains the keyword. You can step through each bookmarked line by going to Search > Bookmark > Next Bookmark. You can clear the keyword highlights and all the bookmarks by going to Search > Mark > Clear all marks and Search > Bookmark > Clear All Bookmarks respectively.
Learn more about DMC's Embedded Development and Embedded Programming services and contact us for your next project.