LabVIEW Debugging Tips: Conditional Probes
The LabVIEW probe tool is tremendously helpful for debugging applications, but when there are multiple probes scattered throughout multiple VIs it can be hard to keep track of all of the values while running your application. Or, even more difficult is trying to debug an infrequent error, without spending hours watching execution highlighting, or constantly hitting a breakpoint in the code when there is no error.
This is where the conditional probe starts to shine. Using a conditional probe instead of a standard probe, you can tell LabVIEW to pause execution when the value on the wire being probed meets a certain condition, otherwise continue to run as usual.
Combining the conditional probe with the retain wire values, you can run your application at full speed, and only when a specific error occurs will the code pause and then you can probe the rest of the block diagram and debug the specific VI.
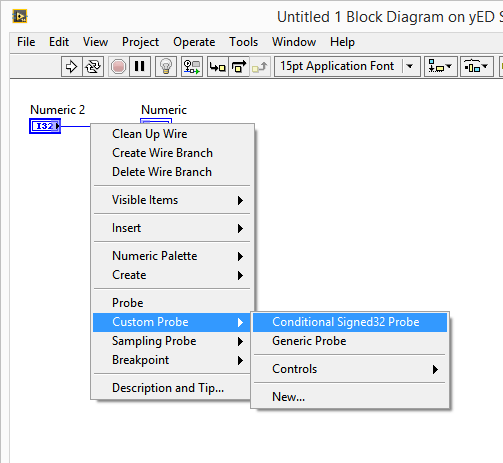
To insert a conditional probe, right-click the wire of interest and select Custom Probe>>Conditional XXXX Probe. This will open a slightly modified probe watch window where you can specify the condition on which to pause execution. Unfortunately, conditional probes are not supported for all data types, but being specific to the data type helps in specifying the pause condition. For example, strings and paths support regular expression matching, errors can be matched or ignored based on the error status or code, and numerics can be specified as ranges.
Learn more about DMC's LabVIEW programming expertise.
Comments
There are currently no comments, be the first to post one.