DMC routinely completes projects involving a variety of technologies including Bluetooth connected devices and web-based API’s. During a recent FedEx Day, where everyone in the company works on a project that interests them and that they think will improve DMC, we decided to combine a few of those technologies and create a system for tracking the locations of our many office dogs!
Getting Started
FedEx Day requires that a project is completed in the span of FedEx day. Depending on the project, this is not always an easy feat. We knew we needed a way to figure out where a dog is hard at work in our office and transmit that information to a display. It was time to incorporate IoT.
Bluetooth beacons provide a value for their signal strength (RSSI) when they broadcast. Since signal strength can be roughly correlated to distance, we decided to set up a bunch of Bluetooth scanners around the office and look for beacons. The scanners then report which beacons are nearby to a custom web service that receives the data, triangulates the location of each dog, and displays their locations on a map.

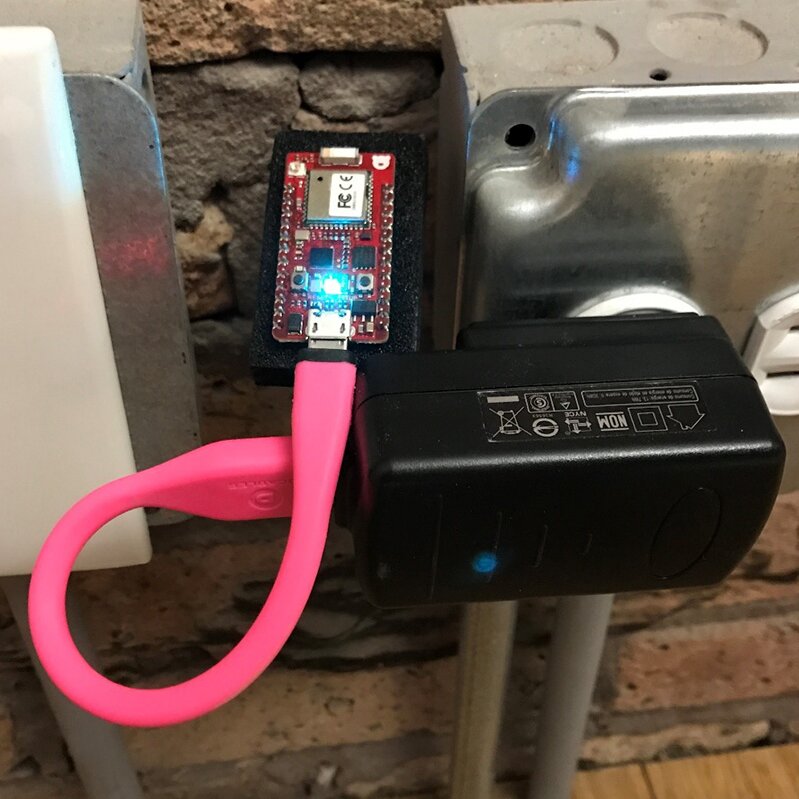
Rosco the dog rests after testing out the tracker on FedEx Day
Putting the Plan into Action
For our beacons, we purchased some off-the-shelf Tile modules. Tiles will continuously broadcast a beacon signal and can be easily attached to a variety of objects.
Next, we needed some devices for scanning the beacons that are also internet connected. We chose the RedBear Duo, a thumb-sized development board that features both WiFi and Bluetooth LE. The Duo connects to the internet through Particle’s Cloud. A simple program allows us to perform a Bluetooth scan periodically and transmit the scanned MAC addresses and associated RSSI to the Particle server.
We created an integration in the Particle console to repackage the data and send it to our own web API built in ASP.NET Core, which pushed the data into a Microsoft SQL database.
Displaying the Data
Now that we had information about all our nearby Bluetooth devices, we needed to figure out how to use that information!
We utilized Microsoft’s PowerBI tools to visualize the data coming in.
PowerBI can easily connect to a Microsoft SQL Database and import data. Using PowerBI to build some custom dashboards, we developed an algorithm to triangulate the location of a given beacon based on which scanners had seen a beacon and how close the beacon was to each scanner.
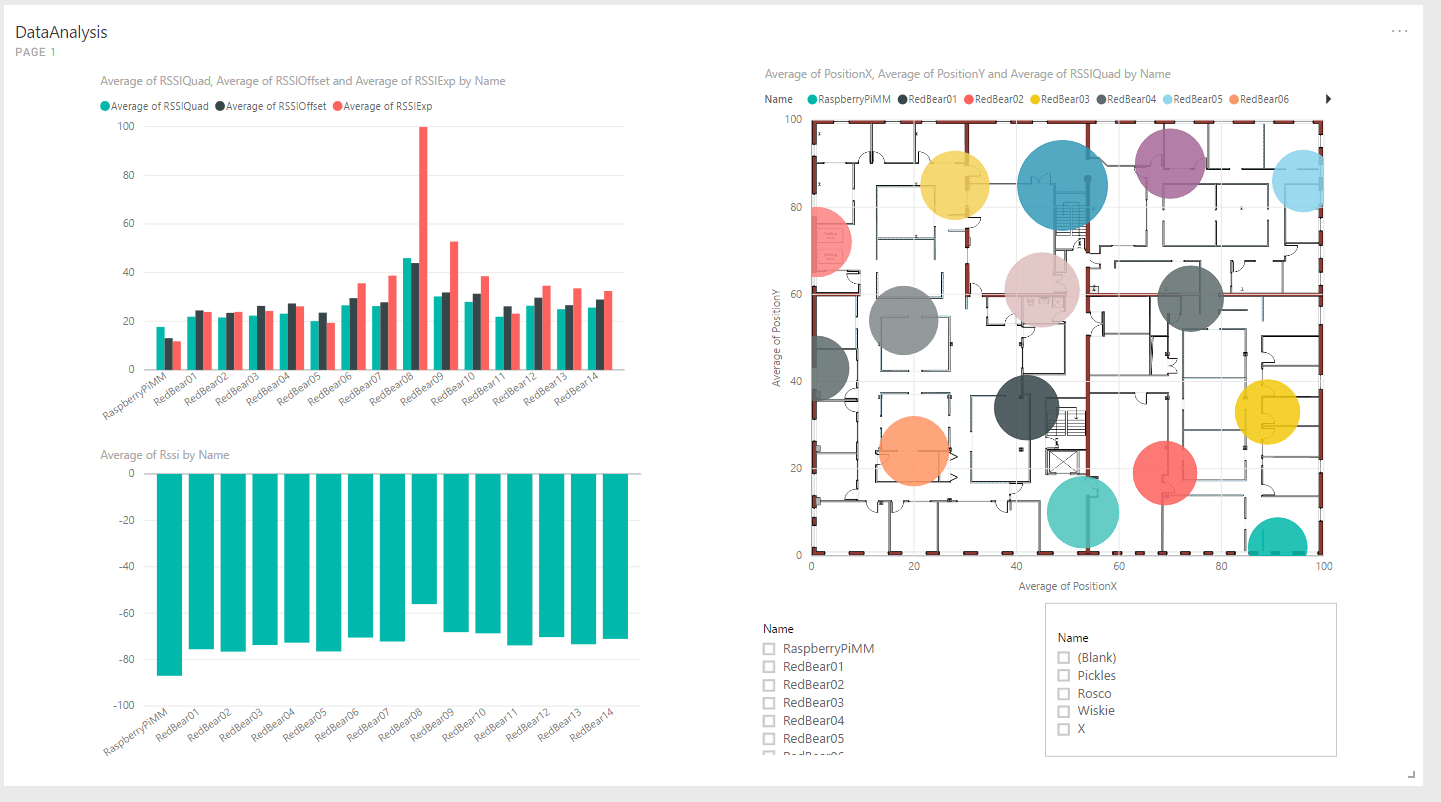
DMC’s Power BI Dashboard
We created a simple website to display the current locations of all the dogs in our offices. The beacon locations are plotted on a Google Charts Scatter Chart overlaid on top of a map of the DMC office, making it easy to see what room each dog is in.
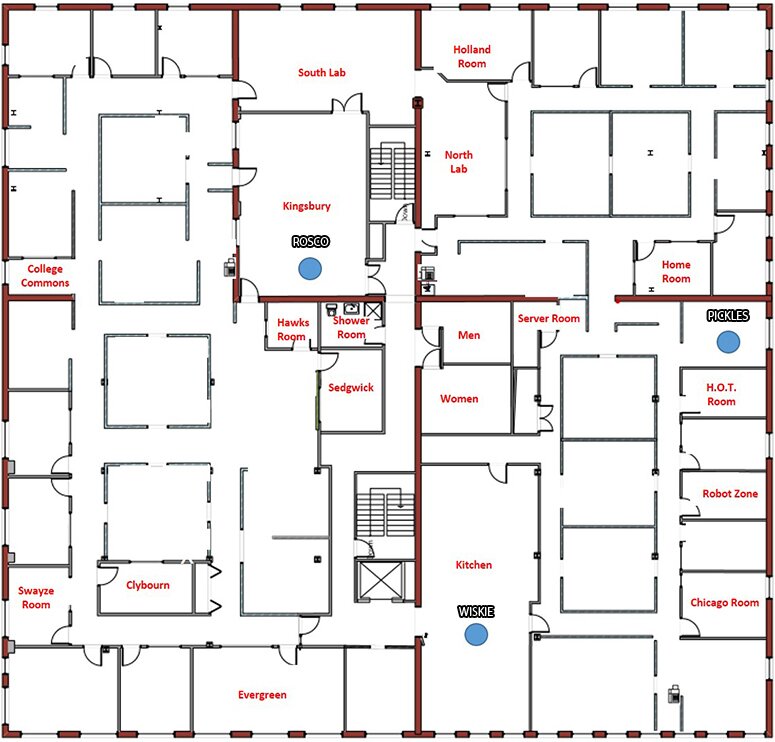 DMC Dog Tracker Map
With some SignalR functionality, you can watch each beacon move around the map in real-time. The triangulation isn’t perfect due to interference from walls and the uneven spacing of our scanners, but it ended up working pretty well!

Check out the projects from our latest FedEx day or learn about DMC's Custom Software & Hardware Development!