Let’s face it, engineers and scientists like graphs. It’s very common for a user to desire an image capture of data displayed in their program to share with their friends and colleagues. There’s quite a few nice features native to LabVIEW that makes this process easy and convenient. Here is a description of three good options: Manual Save, Programmatic Save, and Save Entire Tab.
Manual Save
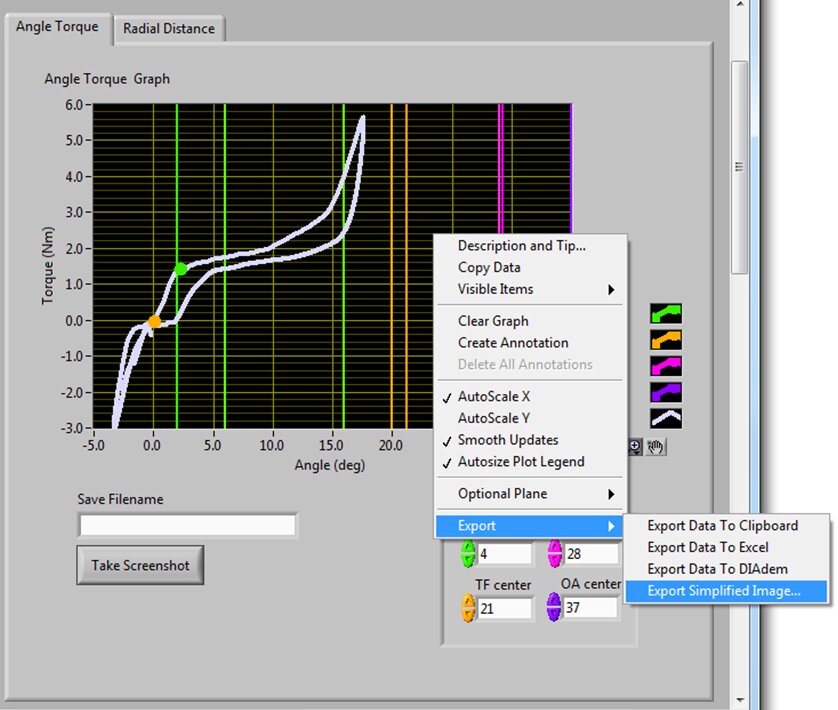
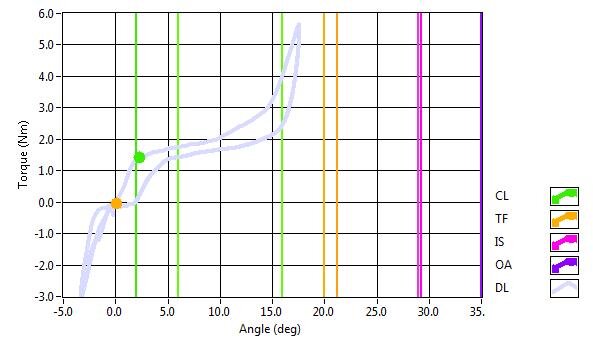
You can manually right-click any graph or plot during runtime and select Export > Export Simplified Image. Choose a name for your *.bmp image and directory and save an exact image of the graph to disk. Notice that LabVIEW automatically changes the default black graph background to white, but doesn’t alter any of your active plot trace colors. Also note that a graph save captures only what is seen by the user during that instant.
Programmatic Graph Save
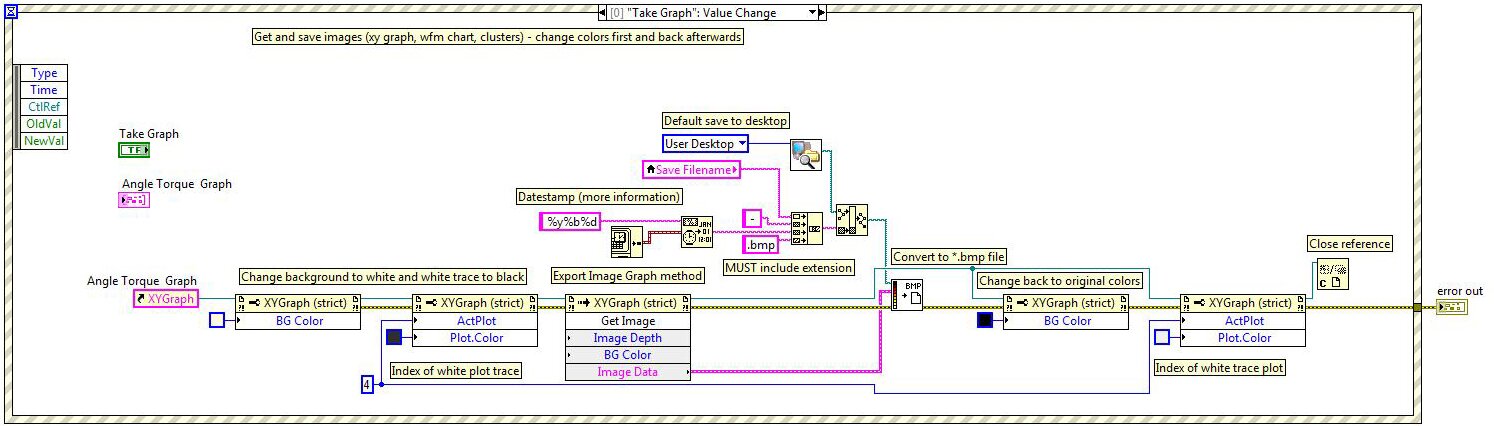
This save feature is also available programmatically through LabVIEW methods. When not running, right-click on the graph you’d like to save during runtime and create a reference. Find and select the graph method “Export Image”. Wire the ‘Image Data’ output from the node into one of the image write VIs found in the ‘Graphics and Sound’ > ‘Graphics Formats’ palette. Make sure to append the correct file extension to your path. While you’re here, you should automatically change the background and plot trace colors to more desirable selections. This will cause the graph to flash briefly during the save but will create a much nicer image.
Save Entire Tab
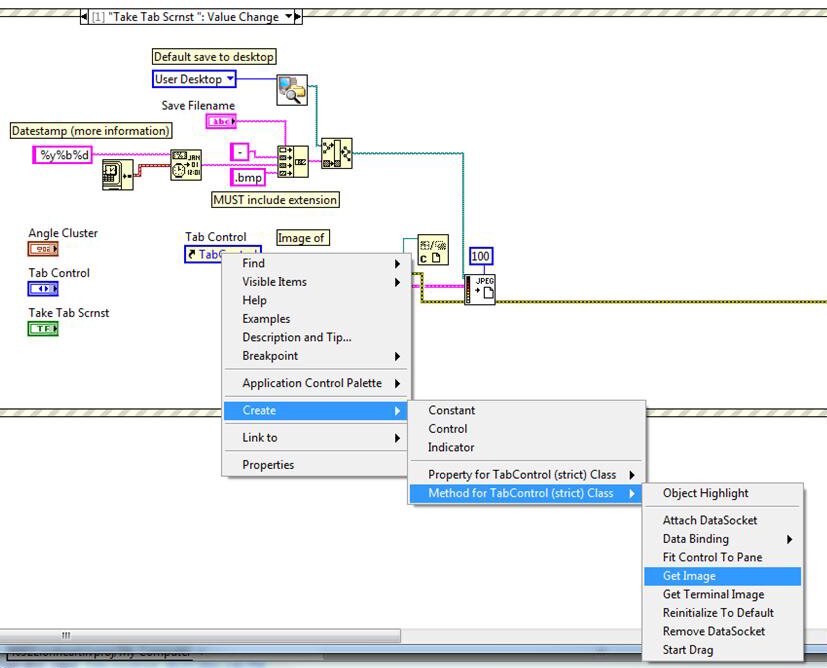
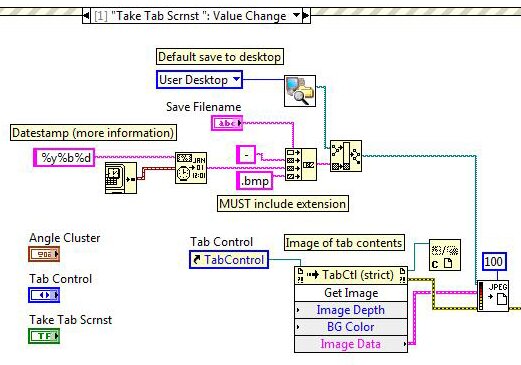
Often the graph doesn’t contain all necessary information such as user parameters governing the process. If these setting are available near the graph on a tab control, you can take a screenshot of the open tab and save it to disk. The method is very similar to the single graph save, but simpler since the graph colors don’t need to be altered.
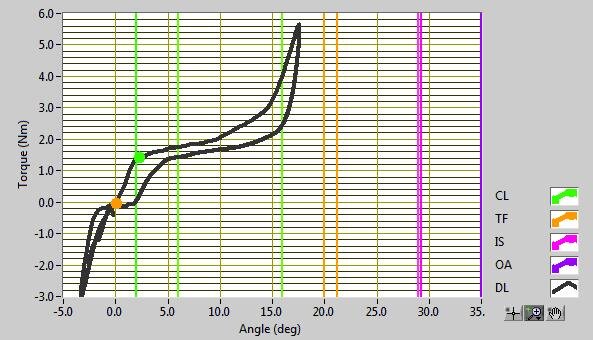
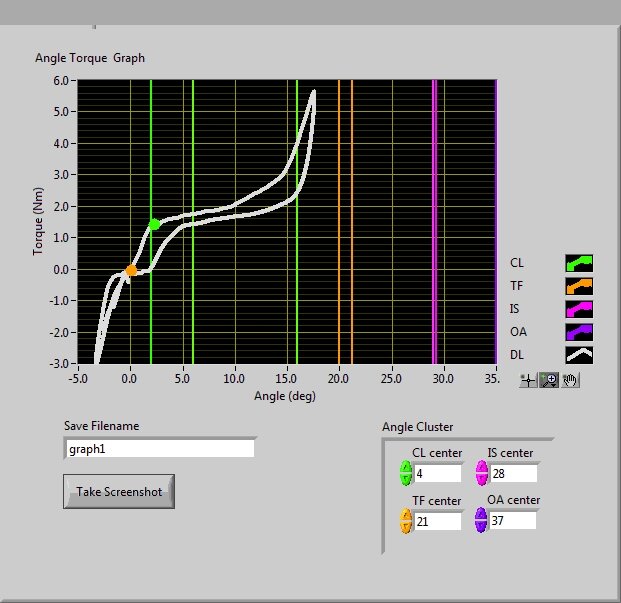
Here you can see the image “graph1 – 11Oct27.bmp” as produced by the above code. Notice the angle cluster and graph title is also captured, giving more context to the displayed data.
Hopefully you will find these methods useful and easy to implement. Feel free to add any additional features or solutions that you utilize in the comments below.
Learn more about DMC's LabVIEW expertise.