This blog will cover how DMC increased the speed of a rate-limiting process step for the ThyssenKrupp Waupaca foundry. It will cover the following:
- Construct a basic motion model with a spreadsheet.
- Optimize a non-linear motion profile to match a non-linear mechanical system.
- Implement the solution in Siemens SiMotion Scout.
- Generate a complex motion profile using electronic camming.
- Try out some Microsoft Excel tips and tricks.
Table of Contents
Introduction and Background
Return to the Table of Contents
This technical blog describes the optimization of a simple motion profile based on construction of a physical system model using a simple spreadsheet. While the approach, model, and tools described in this paper are very general and can be applied to any basic motion optimization, here we focus on a specific motion optimization process recently completed for a specific DMC Client, the ThyssenKrupp Waupaca foundry.
ThyssenKrupp Waupaca (TK-Waupaca) is a gray, ductile, and compacted graphite iron foundry located in Waupaca, WI. A foundry is a manufacturing facility that produces solid metal castings by pouring hot molten metal into a mold. For iron casting, the molds are typically made of sand. The metal is allowed to cool and solidify after which the mold is removed by shaking, resulting in the final metal part, the ‘casting’.
To create hollow features inside a casting, a ‘core’ is inserted into the mold (Figures 1-3). For Iron castings, this core is also made of sand with its shape held together by a binding agent. In large foundries, such as TKWaupaca, placing the core inside the mold is an automated process preformed by a large mechanical tool called a ‘coresetter’. In simplest terms, a coresetter is a large, 2 ton, pick and place machine.

Figure 1. The Coresetter places a core inside the mold produced inside the sand column. [1]
In this blog, you will find out how DMC increased the speed of the TK Waupaca coresetter machine.
Certain elements of TK-Waupaca’s design are being claimed in a patent application pending in the US Patent and Trade Office.
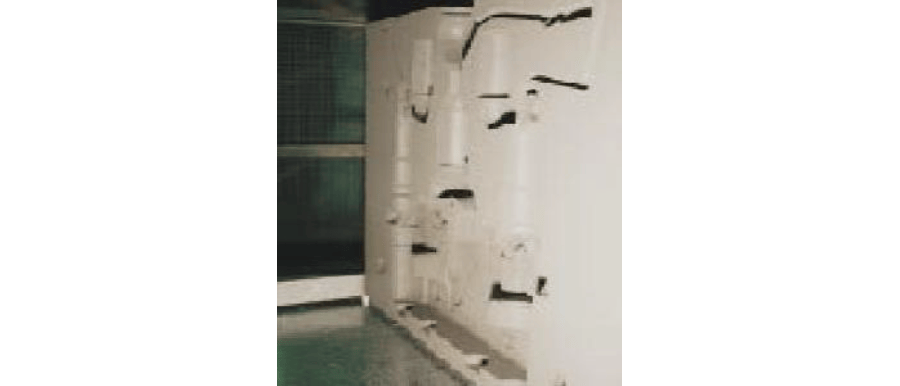
Figure 2. A pattern creates an impression in a slice of a horizontal sand column

Figure 3. A core is a solid block of molded sand held by a binding agent. It is placed in the Coresetter to form a hollow cavity in the final metal part.
Problem Statement
Return to the Table of Contents
TK-Waupaca designed and built their own coresetter, and operates similar coresetter machines at three other foundries in Wisconsin, Indiana and Tennessee. The process step preformed by the coresetter machine, placing the core inside the mold, is a critical, rate limiting step in each of these foundries. The faster the coresetter operation runs, the more castings the foundry can produce in a given time period, directly increasing profitability of the entire foundry.
TK-Waupaca had been operating their Coresetters with a minimum stroke time of 1.4 seconds. This limit was based on an operational torque limitation in the motor, which would be exceeded if the existing motion operation were simply run faster. They had observed that their existing motion system would over-torque the motor at one part of the cycle as they increased the speed. However, at other parts of the cycle, they were well below the motor’s torque limit. What they needed to achieve is a system operating at a more uniform torque level, making better use of the motor’s power at all points in the motion cycle.
TK-Waupaca had performed a simple dynamics simulation which indicated that, under uncontrolled torquemode conditions, the coresetter should be able to perform the move in 0.62 seconds. While the model was showing them the operation could theoretically run faster, they were unsure how to approach the problem and implement a solution.
Since all of the automation electronics on their coresetter system were produced by Siemens, TK-Waupaca looked to their local Siemens sales representative for assistance. Siemens referred TK-Waupaca to DMC, a Chicago based Siemens Solution Partner, to complete the analysis, modeling, and engineering efforts required to meet their goal of reducing the coresetter cycle time to 0.75 seconds.
Mechanical System
Return to the Table of Contents
The coresetter fixture that TK-Waupaca designed weighs 2 ton when loaded with a core. The system is shown in the schematic of Figure 4. The entire system travels along linear roller bearings a total distance of 55 inches (1.4m). The coresetter is actuated by a large AC, synchronous motor under position control by a Siemens 315T technology PLC. The motor drives a crank arm through a double-reduction gear box with a 22:1 ratio. The crank and connecting rod drive a linear carriage, which places the core in the mold.
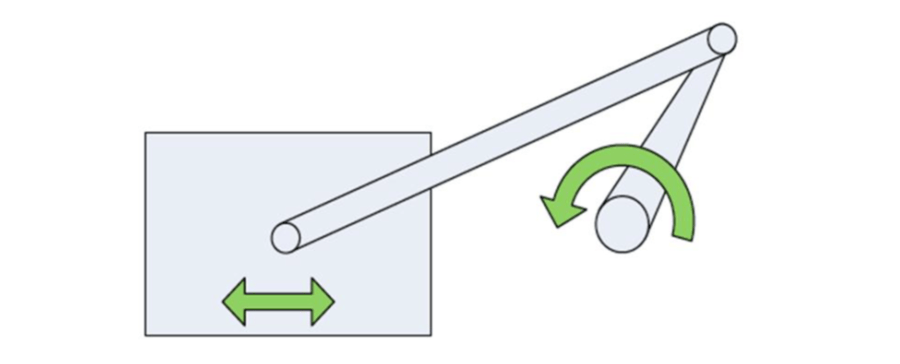
Figure 4. Mechanical layout of TK-Waupaca's coresetter machine.
Baseline Implementation
Return to the Table of Contents
The simplest way to perform the coresetter move would be to ignore the connecting rod carriage and just make a constant angular velocity move on the crank with acceleration ramps. TK-Waupaca implemented this strategy first, and experienced motor torque limitations, even at low speeds.
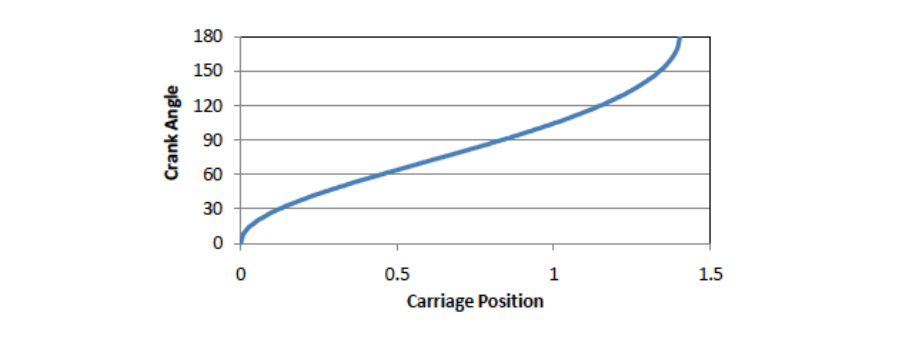
Figure 5. TK-Waupaca's initial cam table relates Crank Angle to Carriage Position based on crank arm and connecting rod geometry.
TK-Waupaca had correctly realized that the mechanical power transmission path was non-linear, and were attempting to compensate with their motion profile. They had created an electronic cam table that related Crank Angle and Carriage Position by a function derived from the crank and connecting rod geometry. TK-Waupaca implemented a virtual axis to represent the carriage position, and they synchronized their crank axis to this virtual axis with the cam function shown in Figure 5. The control strategy was to command a constant linear velocity move with acceleration and deceleration ramps on the virtual axis representing carriage position. This solution had slightly improved performance against the constant angular velocity method. Captured torque and velocity traces for such a move are shown in Figure 6, where the non-linear velocity profile and generated torque spikes are obvious.
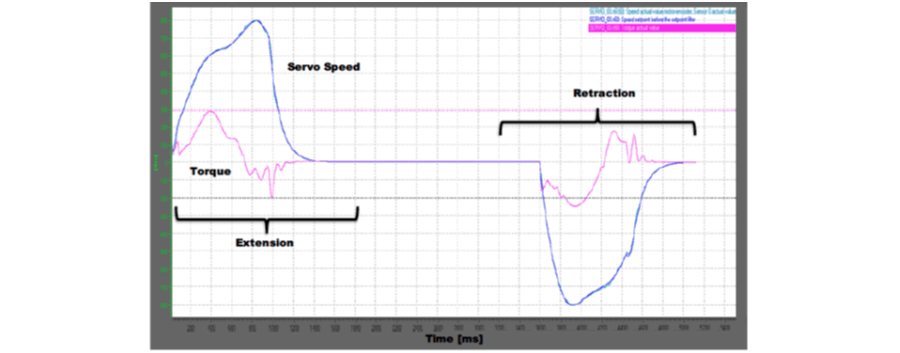
Figure 6. Initial coresetter velocity and torque. The thin line at 300 indicates the torque limit.
DMC's Approach
Return to the Table of Contents
DMC took a different approach to TK-Waupaca’s motion problem. Since both prior experience with the coresetter machine and TK-Waupaca’s simulation show that the system is limited by motor torque, and not maximum motor velocity or motor thermal limitations, a constant torque profile could immediately be determined as the most efficient method go get from A to B the fastest. Of course, for the system to return to rest at endpoint B, the torque direction must be inverted midway through the move.
The simplest way to implement a constant torque motion would be to abandon closed-loop control. Without generating a position vs. time motion profile, it would be possible to set the motor to full torque in the forward direction, then at some mid position set the motor to full torque in the reverse direction and turn the torque off, or re-engage position control, when the axis came to a stop. This is precisely what TK-Waupaca had assumed in their motion simulations to determine that performance at half of their current travel time was indeed possible.
While operating the system open-loop with constant torque would certainly get the system from A to B very quickly, it would create a number of problems:
- The exact stopping position would not be consistent from one cycle to the next.
- The exact time of the move would not be consistent.
- Obstructions which would otherwise cause following error faults would go unnoticed.
- Open-loop control of a 2 ton object is generally unsafe.
DMC’s sought an approach to achieving the performance benefits of the constant torque cycle, while avoiding the problems associated with open-loop operation. In this case, the approach was to create a custom motion profile which mimics the motion of the open loop cycle, but can be implemented using closed-loop control.
DMC's Mechanical Model
Return to the Table of Contents
To achieve this goal, DMC built a new dynamic model of the mechanical system using a simple spreadsheet. The system was modeled as a rotary component in the frame of reference of the crank and a linear system in the perspective of the carriage. Frictional effects were disregarded because the system moves on roller elements. The rotary and linear components are tied together by a non-linear transfer function specified by crank and connecting rod geometry. Since the goal is to hold torque constant, the rotary component is defined as the input and the carriage position is defined as a function of rotary angle. A table of carriage linear position vs. crank rotary angle was generated with 1 degree resolution (plotted in Figure 7). The table was twice numerically diferentiated to calculate the first and second dirivitives of carriage position with respect to crank angle (also plotted in Figure 7).
Next, values were estimated for rotational and linear inertia constants. A standard simplification for a connecting rod used in engine design is that 1/3 of the mass is applied as a point mass on crank at the crank radius, and 2/3 of the rod mass is applied to the linear mass. The rotational inertia is calculated from the reference of the crank, not the motor. So all inertia values on the motor side of the gear box are multiplied by the gear ratio squared.
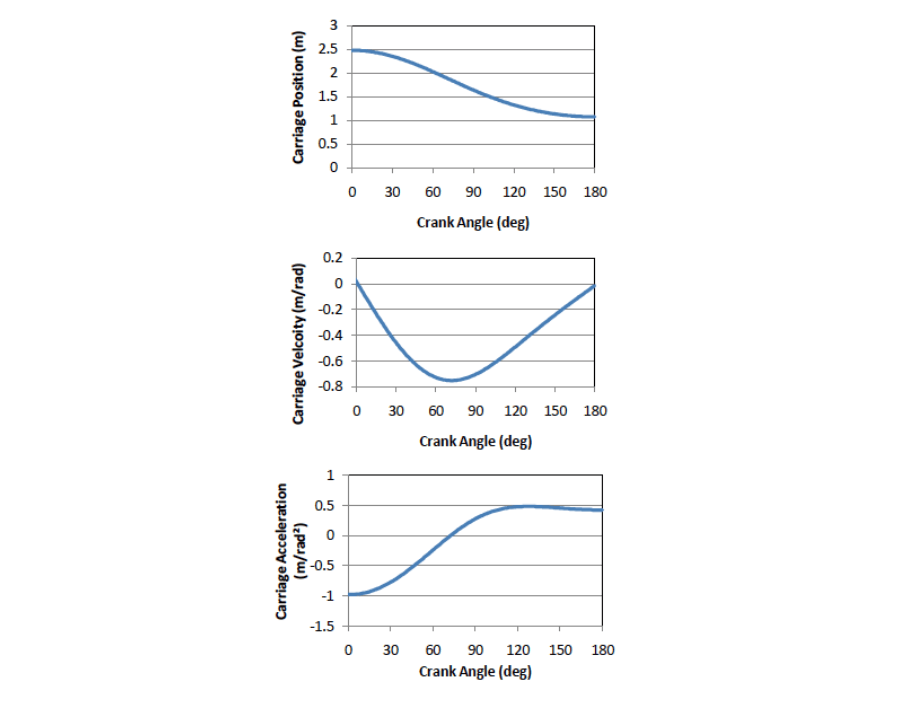
Figure 7. Motion relationships between crank angle and carriage position (top), velocity (middle), and acceleration (bottom).
Next, the equation of motion was determined. The equation of motion relates the system acceleration to the force input and physical constants of the system. The equation of motion for a simple mass with force acting upon it is Newton’s second law of motion: 𝑓=𝑚∗ 𝑎 , where 𝑓 is the force, 𝑚 is the mass, and 𝑎 is the acceleration. The equation of motion for our crank must account for the torque applied by the motor, 𝑡𝑚 the rotary inertia, 𝐽, and the torque transferred to the linear component through the connecting rod, 𝑡𝑙. Given ∝, the rotational acceleration of the crank in radians/s², the equation of motion for the crank is:
𝑡𝑚−𝑡𝑙= ∝ ∗𝐽 or ∝ = 𝑡𝑚−𝑡𝑙�
The variable which requires additional definition is the torque transferred to the linear system, 𝑡𝑙. In the case of a linear transfer function like a rack and pinion connection, this would be a function of the linear inertia and the effective radius. For the linear system, 𝑡𝑙= 𝑚∝𝑟 2. In other words, the rack and pinion system only exerts torque on the rotary system when the rotary system is accelerating. In that case, the torque is proportional to the linear mass and to the square of the effective radius. Note that the effective radius in the rack and pinion system is the slope of the linear transfer function, 𝑥=𝑟 𝜃. For purposes of the crank and connecting rod equation, 𝑟 can be replaced with 𝛿/𝛿𝜃.
There is a second component to the torque transferred through the connecting rod. Even if the crank is moving at constant velocity, while the carriage is accelerating with respect to the crank, it takes some force to make the carriage accelerate just to maintain constant crank velocity. Generating that force requires torque applied through the effective radius, 𝛿/𝛿𝜃. This torque can be represented by the formula 𝑡= ω2𝛿2𝑥𝛿𝜃2𝑚𝛿𝑥𝛿𝜃 where ω is the rotational velocity of the crank.
The total torque transferred through the connecting rod is the sum of these two terms, or:
𝑡𝑙= ω2 𝛿 2 x/𝛿𝜃 2 𝑚 𝛿/𝛿𝜃 + 𝑚 ∝ (𝛿/𝛿𝜃) 2
So, the equation of motion for the crank is:
∝ = 𝑡𝑚− (ω 2 𝛿 2 𝑥 / 𝛿𝜃2 𝑚 𝛿𝑥/𝛿𝜃 + 𝑚 ∝ (𝛿𝑥𝛿𝜃 2) ) / 𝐽 which simplifies to ∝ = (𝑡𝑚− ω 2 (𝛿 2 𝑥 / 𝛿𝜃 2 ) 𝑚 𝛿𝑥/𝛿𝜃) / 𝐽+𝑚 (𝛿x/𝛿𝜃) 2
Now we set initial boundary conditions and use Euler method integration to solve for the function of crank position, 𝜃 versus time. The initial conditions are:
𝜃=0, 𝑡𝑖𝑚𝑒=0, ω =0
Given a function of motor torque with respect to time, 𝑡𝑚=𝑘, ∝ can be calculated for the initial condition. Note that 𝛿 2 𝑥 / 𝛿𝜃 2 and 𝛿𝑥 / 𝛿𝜃 were previously calculated as functions of crank angle, 𝜃 as shown in Figure.
For the second iteration and all subsequent iterations, new values of 𝜃and ω are calculated based on the previous iteration’s acceleration and the time between steps. New values for 𝛿 2 𝑥 / 𝛿𝜃 2 and 𝛿𝑥 / 𝛿𝜃 are obtained by a look up function for each iteration, and a new value for ∝ is calculated. The Crank Velocity function that results from this integration and the corresponding carriage velocity is shown in Figure 8.
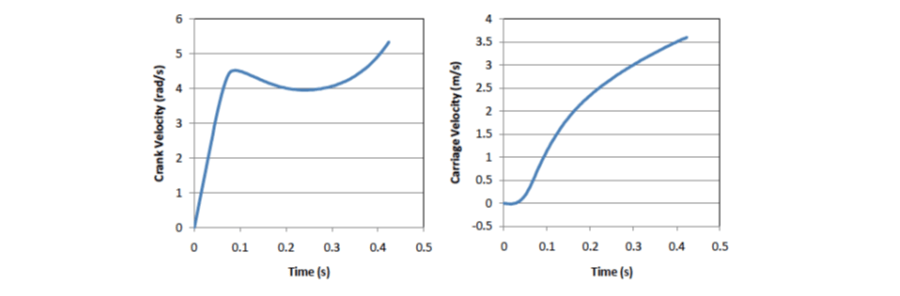
Figure 8. Crank and carriage velocity versus time for the acceleration portion or the move.
The effects of the non-linear transfer functions are clearly shown. Since effects of the carriage are proportional to 𝛿𝑥 / 𝛿𝜃 and to the square of ω, both of which start at zero, the velocity of the crank starts to accelerate linearly. Over time, as ω and 𝛿𝑥 / 𝛿𝜃 increase, the acceleration decreases and eventually the crank begins to slow down. This happens because energy is transferred from the rotary to the linear frames so rapidly that the motor, which is exerting constant torque, cannot keep up. But the carriage does continue to accelerate.
At some point in the move it becomes necessary to change the torque direction in order to come to a controlled stop at the 180 degree position. An energy balance from the crank perspective estimates that this should occur at about 90 degrees of crank position. However given errors associated with numeric integration, changing the torque direction and continuing the integration is unlikely to bring the system to rest at exactly the correct position.
The way to bring the system to rest at the perfect spot is to start a second integration at the final conditions working backward to the start. So the starting conditions for the second integration are:
𝜃=180°, 𝑡𝑖𝑚𝑒=0𝑠, ω =0
From these conditions the model integrates backward in time and applying negative torque. It results in a positive trajectory that ends at the defined conditions. These curves are shown in Figure 9.
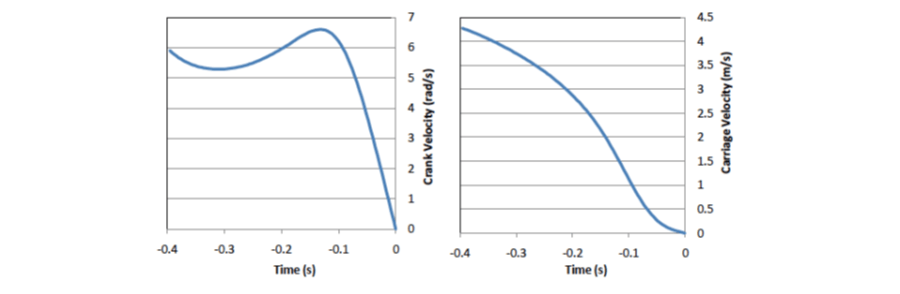
Figure 9. Crank and carriage velocity versus time for the deceleration portion or the move.
The curves near the endpoint share the same characteristics as the curves at the start of the move. However, the system is not completely symmetrical between start and end. At the start, the crank arm and connecting rod oppose each other and at the end they overlap each other. This results in the higher relative acceleration at the start versus the end shown in Figure 10. So the resultant optimized move is expected to asymmetrical.
The remaining step is to connect the two crank velocity curves to create a single profile for the entire move. The rule for making the connection is that the crank velocity and crank position must both be equal at the point of switchover. In Figure 10, the crank velocities are plotted together with respect to Crank Position.
The intersection of these two curves is the torque switchover point. Linear interpolation between segments of the functions is used to determine the crank position of the switchover. Interpolation also determines at what time for each cycle the transition position is reached. The time scale for the deceleration is offset by the total time. Now a complete profile of both velocity vs. time and position vs. time can be created. They are shown in Figure 11.
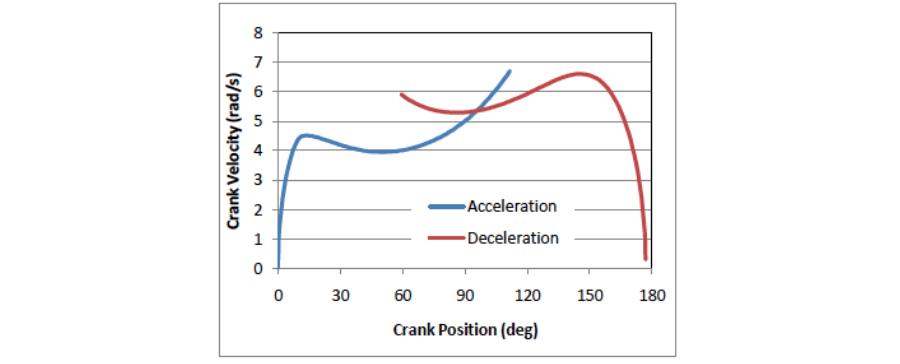
Figure 10. The transition point between positive and negative torque occurs at the intersection between the acceleration and deceleration curves.
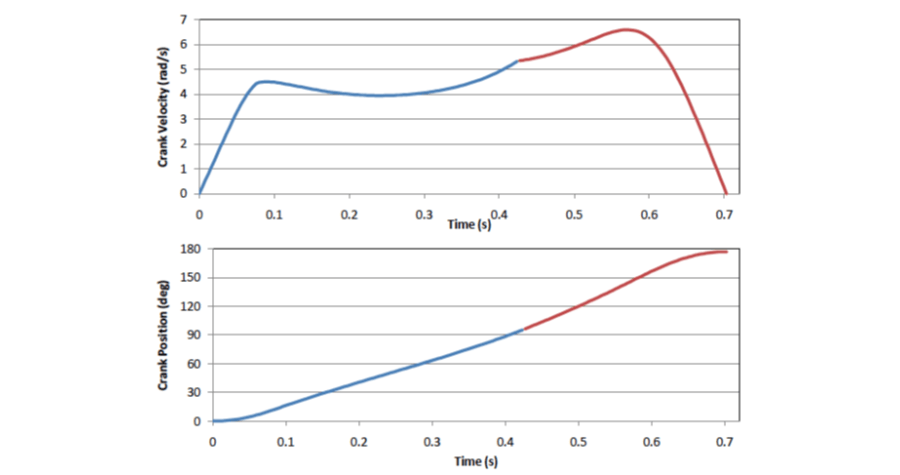
Figure 11. Optimized motion progile results: velocity (top) and position (bottom) vs time. Acceleration and deceleration curves are shown in blue and red, respectively.
Implementation in Siemens Technology CPU
Return to the Table of Contents
Ultimately the crank position vs. time graph is the only element of the analysis that gets implemented into the motion control program, as a simple cam table. In electric camming, the “slave” axis follows a commanded position that is a function of another real or imaginary axis, the “master” axis. In the current system, the slave axis is our crank motor and the master axis is imaginary. A scale of 0 to 1000 was arbitrarily selected as the full stroke distance of the master axis. A set of data points corresponding to the crank position vs. time was copied from the model Excel spreadsheet and pasted directly into Siemens’ SiMotion Scout, as shown in Figure 12.
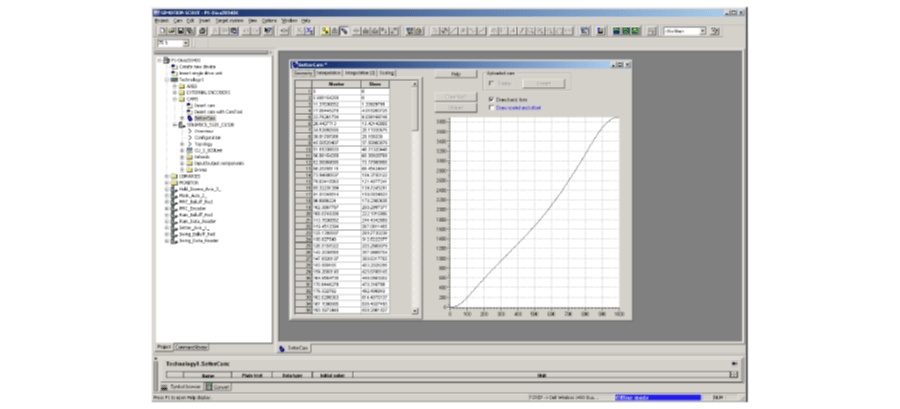
Figure 12. Implementation of cam table in SiMotion Scout.
The program logic is to turn on the camming action at the starting point and then run a timed move through the entire master range, 0 to 1000. Since the cam function already has acceleration ramps built in, the Acceleration and Jerk parameters on the master axis are set to their maximum values. This is done both in the function initiating the move and in the Master axis object Limits page. In addition to this, the Jerk and Acceleration limits for the Crank axis object were also set high.
During on-site testing, the system was still exhibiting sluggish torque ramp-up. The cam function should ramp the axis up to a constant torque very quickly. However, the trace showed high following error at the start and a slow torque ramp up. So the tuning parameters in the Closed-Loop Control tab of the Crank axis object were also modified.
Even after the tuning, there were a couple of low spots and high spots in the torque profile. These were adjusted using a lookup table of torque factors vs. crank position. After adjusting the torque factors at different points, the curve was re-downloaded into the controller. This fine tuning process was repeated until a smooth torque profile was obtained on the system.
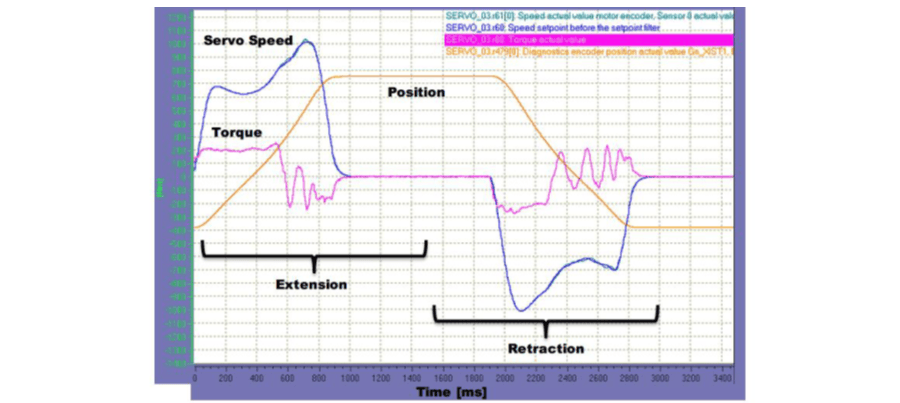
Figure 13. Parameter trace of final motion profile implemented on the TK-Waupaca coresetter system.
After implementing the new program the system was performing with approximately uniform torque during the acceleration cycles as shown in Figure 13. This trace shows the system running at 1.0 seconds move time. However, the system was able to run at the goal speed of 0.75 seconds. When the system was operated at different speeds the torque magnitudes changed, but the shape of the torque curve remained similar to that shown.
When comparing the original torque profile against the new torque profile it is easy to see why a significant speed improvement was possible. Originally the torque bumped against the limit at a narrow point during acceleration. Most of the move time was spent using the motor far from its operational limits. The new motion profile achieved near constant torque and can use the motor near its limit for most of the move.
Future Enhancements
Return to the Table of Contents
One deficiency of the current solution is that the torque during deceleration is not uniform. In fact, as shown in Figure 13, it oscillates strongly. On the reverse cycle, when the cam table is run backwards, the acceleration is fairly uniform while the deceleration oscillates. This points to the most likely cause being that the torque direction change in the middle of the cycle induces a vibration in the mechanical system. Modifying the torque model to include a gradual transition in torque from positive to negative in the middle of the cycle should decrease this vibration. Doing this would round out the peak in crank velocity near the transition in Figure 11. It would only slightly affect the average velocity of the crank over the cycle. Therefore it can be expected to add only a couple of milliseconds to the total move time. A plan to make this change and refine the torque adjustments is currently in the works.
Another slight deficiency to this process is the adjustment of the ending position. The starting point, where the core is loaded onto the coresetter, is a fixed position in space. However there are a few millimeters of adjustment at the ending position, where the core is offloaded into the mold. Currently, we handle this by applying a scaling factor to the entire cam table. Because the cam scaling factor is between 0.99 and 1, it is negligible in this implementation. However, if a similar system had to start and stop at arbitrary points in the stroke, is there a way short of performing the same calculation in the PLC that is currently done in Excel to execute a constant torque profile from one arbitrary point to another?
Conclusion
Return to the Table of Contents
For a fairly small investment of time and engineering, TK-Waukpaca was able to work with DMC to reduce their coresetter placement time from 1.4 s down to 0.75 s. This 40% decrease in coresetter motion time has directly increased the utilization efficiency, and therefore profitability, of their foundry operations.
Excel Tricks
Return to the Table of Contents
The key to performing this analysis quickly was developing the mechanical model in a spreadsheet format. The beauty of the spreadsheet over a syntax based language is that all of intermediate calculations are in the foreground, so it is easy to correct mistakes during the process. But there are some tricks which make this type of work much easier. Here are a few:
• Named Ranges: In Excel, that box in the upper left that shows the current row and column (the Name Box) is also the place to enter names for ranges. A range is a single cell or a group of consecutive cells. For most instances where an absolute cell reference is used, it is easier to name that cell and use the name. It makes complicated formulas more intuitive. The Name Manager is on the Formulas ribbon and is used to modify and delete existing named ranges. The easiest way to name a range is to click in the name box and type a name.
• User Defined Spreadsheet Functions: To create a user defined spreadsheet function in Excel, open the visual basic editor (from the development tab) and create a Module. Any Public function written in the module becomes a user defined spreadsheet function. I made a function called LinearInterpolateLookup and used it extensively in the project. It operates similarly to the Excel Lookup function, but uses interpolation and works with either ascending or descending search ranges.
Public Function LinearInterpolateLookup(ByVal SearchVal As Double, SearchRange As Range, ResultRange As Range, bAssending As Boolean)
The IF() Spreadsheet Function: A simple functions called IF() takes a condition and two possible response values. If the condition is true, it returns the first one, otherwise it returns the second one. This function can be used cascading into itself to make complex conditional trees. An easy way to pull a specific value out of somewhere in a column is to make the condition true only for the row where with the desired value. The first possible response value should be the value you are looking for and the second should be zero. If you copy this formula for the entire column and sum the column, you get the one value you are looking for.