The Scope tool in TwinCAT 3 is typically utilized when debugging during commissioning phases or troubleshooting a malfunctioning machine. As an inaugural member of the Beckhoff Integrator Group, we're very familiar with these processes—we even created a walkthrough on the routine uses and basics of Scope. This blog, however, dives deeper into its functionalities, shows a few more tricks, and addresses scoping references.
Background
 The simple right-click and “Add to Scope” method works most of the time. But, when it doesn’t, it can drive you crazy. So, let’s go through a few tricks that can make your scoping a bit handier, easier to see, and compatible with all target types.
To start, let’s familiarize ourselves with some important terminology. When scoping, you will have targets that you can add to your Data Pool. Targets are the variables you will see in your PLC program, as well as any hardware inputs and outputs. When a target is added to the Data Pool, it remains a target. However, once it’s added to an Axis, it is now a channel. So, go ahead and make a YT Scope Project (as outlined in the aforementioned walkthrough), add your YT Chart, axes, and channels.
Stacking Axes
Stacking axes can be very handy to better distinguish channels of varying scales without having them overlayed. This is especially helpful if you have several BOOL channels together.
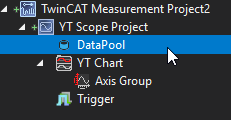
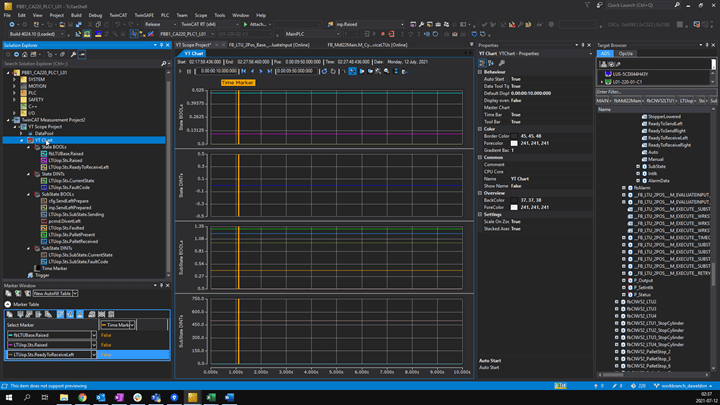
- After adding and renaming all my axes and channels, my solution explorer window looks like the figure on the right. As you can see, I have many channels divided into axes by data type and category. This is both for organization and so that I can easily see the channel signals once I stack the axes.
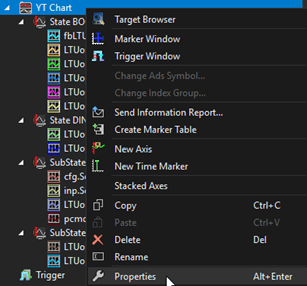
- To stack the axes, right-click on your YT Chart and select Properties. This will open the properties window.
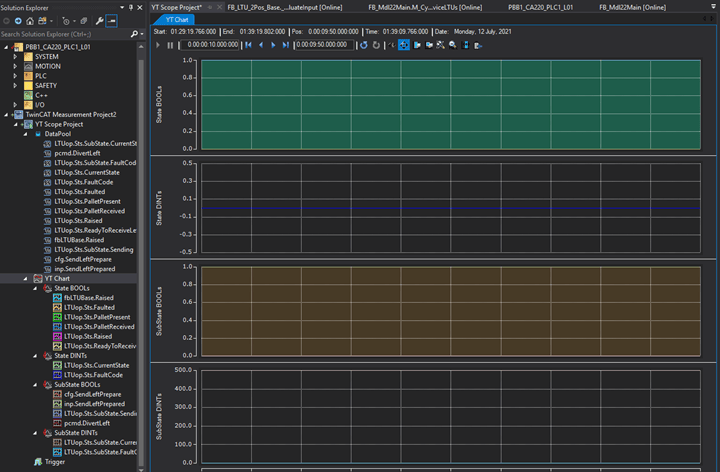
- At the bottom of the list of properties, you will find the Stacked Axes option. Change it to True. This should give you a nice layout of all your axes stacked vertically in the order of which they appear in the Solution Explorer Window. For greater visibility, go to the properties of each axis and show the Y-axis title: Properties Window -> Y-Axis -> Show Title (Y) = True and then change the title to something descriptive. I often use the same names used for the axes.
 Horizontal Zero
I don’t particularly like this method of plotting the BOOL channels. So, I prefer to turn it off. Right-click on your channel -> Properties -> Line -> Fill Mode -> None.
Finding the Signal
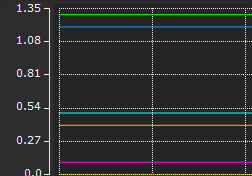
Sometimes, it’s difficult to see where a signal is—like in the top graph in the figure above. This is made even more difficult when the signals are on top of each other. For a quick reference, you can simply double-click on the symbol next to the channel in the Solution Explorer Window and it will briefly highlight the signal in the graph.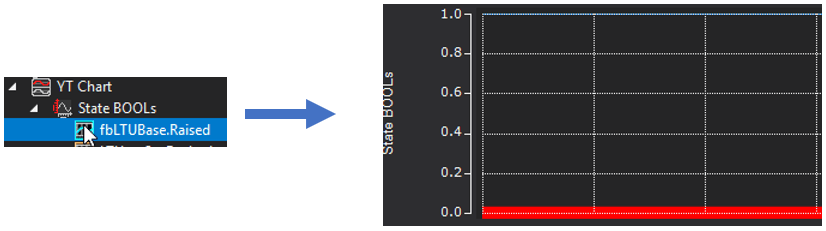
 Another option for BOOLs that share the same axes is to add a small offset to each channel. Since I have six channels, I give them offsets 0 to 0.5, thus separating them for easier viewing. And since they are BOOLs, it’s still easy to see when they are 1 or 0.
Finding the Source of a Target
If you have a scope and don’t remember where a particular channel is coming from or you have someone else’s scope, then you might need to find what the source of the channel is. To do this, right-click the target in the Data Pool -> Properties -> Symbol ADS -> Symbol Name.
Adding Hardware IO Signals
If you know roughly what your IO signal is named, then you can:
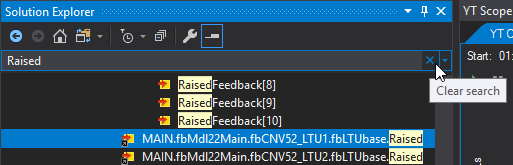 Go to the Solution Explorer Window and, in the search bar at the top, begin typing the name of the signal you want to find.
- Then scroll down until you find that signal, select it, and then clear your search.
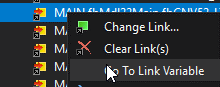 Once again, scroll down until you see the signal you selected, right-click -> Go To Link Variable. This will bring you to the actual hardware signal it's linked to.
- Now, we right-click -> Add Scope. This will add the targets to your Data Pool as well as create a new YT Chart and axis for its corresponding channel. I prefer to delete the newly created “YT Chart (1),” rename the target in the Data Pool, and finally drag it into the axis I want.
Time Marker & Marker Window
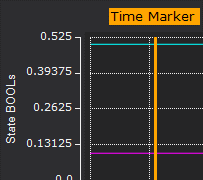 Oftentimes, it’s handy to have a vertical line that you can move to a specific point in time and know the values of all your channels at that point. To accomplish this, we add a Time Marker and a Marker Window to view the values of our channels.
- Right-click on your YT Chart -> New Time Marker. This will show up in your YT Chart Window where you can click and drag it along your time axis.
- Again, right-click on your YT Chart -> Marker Window. This will open the Marker Window, which will probably be undocked. I prefer to have it under my Solution Explorer Window.
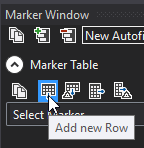
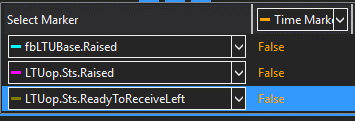
- In the Marker Window, add a new row for every channel you want to see the value of as you slide your Time Marker.
- Each row will have a drop-down menu in which you can select a channel on one of your axes.
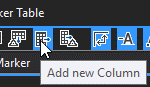 Finally, add a column. This will only have one drop-down menu as you only have one Time Marker.
- Now, you should be able to see the value of all your channels at any point in the time axis of your YT chart.
References and Pointers
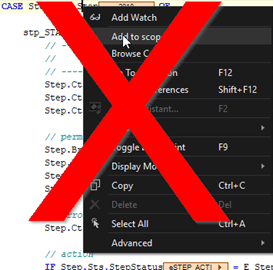 While we didn’t show any pointers in the above tricks and tips, the caveat for adding them is the same as for references: DON’T RIGHT-CLICK AND “ADD TO SCOPE”!
Why? Simply put, your graph will have very strange values in it. For example, if you are online with a PLC and see a variable that’s changing too fast for you to monitor live, you might just right-click it and add to scope. Suddenly, a tag that should have a range of 10 to 2,000 is showing values > 180,000. If this happens, add it through the target browser by finding the source variable at which the reference is looking. This error could occur because the reference is part of a DUT structure where the value is not easily dereferenced. Regardless, the recommended method is to use the target browser.
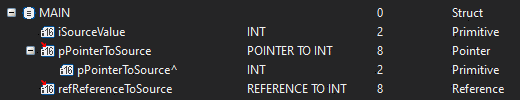 But how do you know what is and isn’t a reference/pointer? When searching through the target browser, you’ll see a little red arrow that indicates whether the tag is a reference/pointer. Here, you have the choice of Primitive & Pointer to the Primitive for one variable, and a choice of Primitive & Reference to the Primitive for another. This makes it easier to find the dereferenced value.
Beckhoff's TwinCAT 3 is a versatile platform with a variety of powerful tools like Scope and like any tool, its power relies on knowing how to use it. Hopefully, this blog helped advance your TwinCAT 3 knowledge and capabilities so you can utilize the software to its fullest potential.
Learn more about DMC's Beckhoff and TwinCAT 3 programming expertise and contact us today to get started on your next project.