My team and I were tasked with creating a chart to visualize cam profile data for a recent project. The project involved making updates to a Siemens Comfort Panel HMI program, including four cammed axes. Our client wanted the ability to adjust a handful of coordinates along the cam profiles and then preview the changes graphically without having to run the system.
My experience drawing graphs on Siemens HMIs has mostly involved trend views which show live data as a function of time. Visualizing cam profiles for this project involved datalogging methods coupled with an f(x) trend view.
Two resources that were imperative to setting this up were this Siemens blog (Creating an f(x) Trend View for Comfort Panels and WinCC Runtime Advanced) and this DMC blog (Custom Data Logging using a Siemens Comfort Panel and VB Script). I found the implementation very interesting and highly encourage the use of this visualization strategy for future motion control projects.
This blog in particular will take you through the step-by-step of creating a basic project, adding the VB Script for datalogging, and configuring your trend view.
Step 1: Array Setup
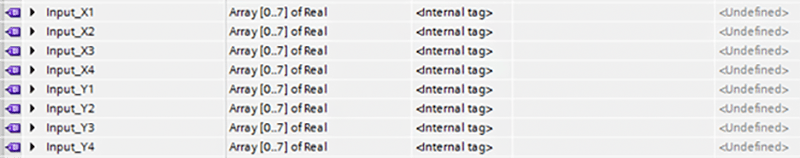
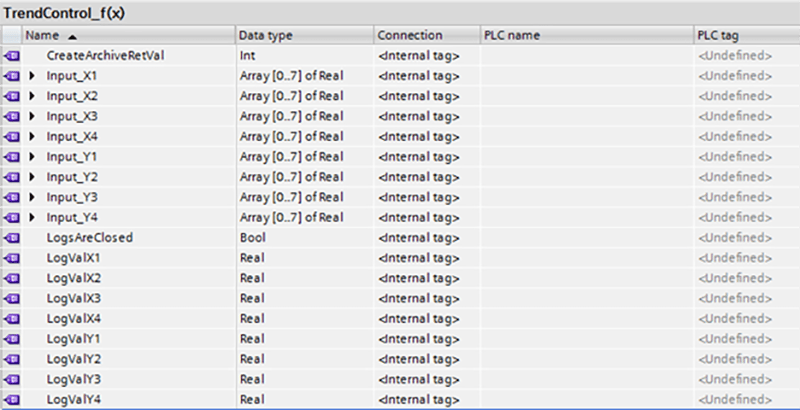
For the purposes of this application, we set up eight arrays to capture key position data from each axis. These arrays are local to the HMI so that operators can preview changes. When they are satisfied with the results of the preview, they can run a separate script that copies the HMI data to the PLC. To set up my test application, I defined all of these arrays in a tag table on the HMI.
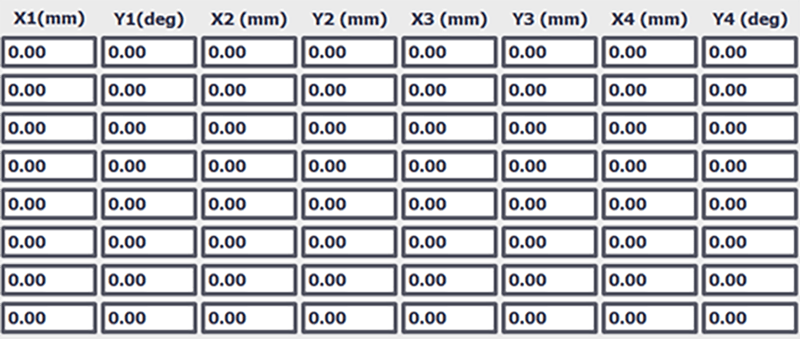
Then, I created an HMI screen with I/O fields for each of these array values.
Step 2: Add Script to Log Data
Now that we can adjust our array values from the HMI, it’s time to create some data logs. To display our data on the built-in f(x) trend view, we need to ensure that all the (X, Y) value pairs we will be graphing have identical timestamps. We are using a script to achieve the data logging to ensure that an identical timestamp is used for all data, the values can be archived on demand, and that the input arrays are stored as a series of individual values.
The script is the meat and potatoes of this whole project, so we’ll go through it chunk by chunk. One important thing to note is that Windows PCs, like the computer I am simulating this project on, use slightly different syntax for file-handling functions than Windows CE, which is the operating system running on Siemens Comfort panels. Please see “Changes for Windows CE” below for the updates that need to be made to the script for deployment on actual hardware.
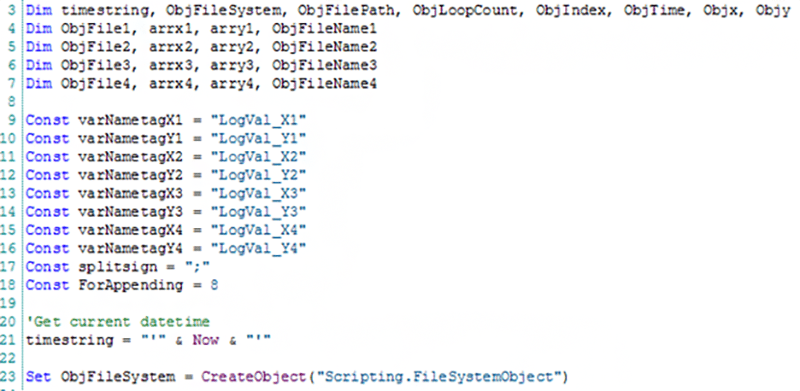
The first step in our script is to declare variables. I determined it was easiest to create 4 separate trend logs for our 4 separate trends. The split sign in this CSV file is set as a semicolon for this example. Data delimiters may vary by the country setting of the operating system.
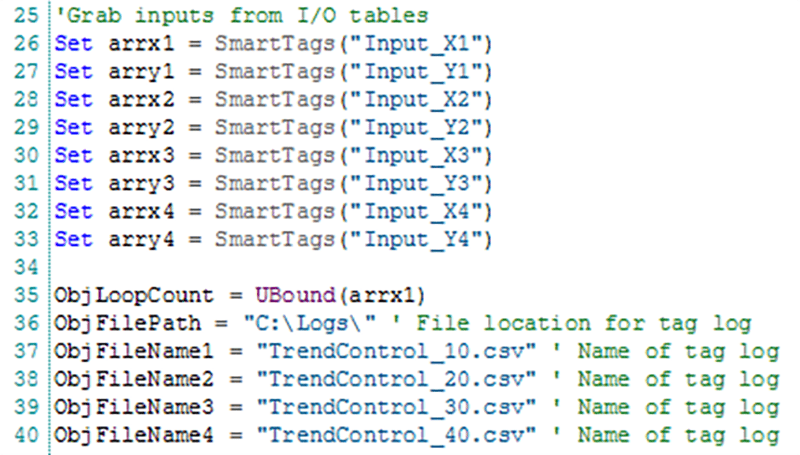
Next, we assign the values in our tables to arrays that live on the HMI. We also create our CSV files that will hold our logs. The filename of each CSV file has a “0” appended on the end – this was important during testing to get it to match up with our historical data configuration (keep reading for more information on this).
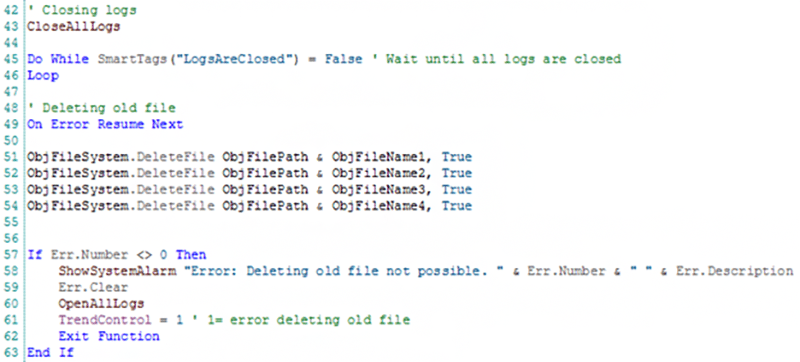
In order to use these CSV files, we need to make sure our logs are closed. In this case, we must also delete the old files each time the script runs. As mentioned before, all entries in the log must have identical timestamps. If the old file is not deleted, there may be mismatched data present. We’re using a return value in our function to detect if an error occurred during execution.
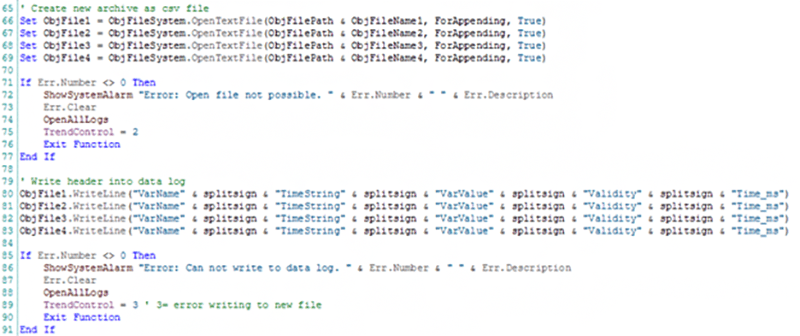
Now that the old files are gone, we must create new files to store new data. Each file is instantiated with a header.
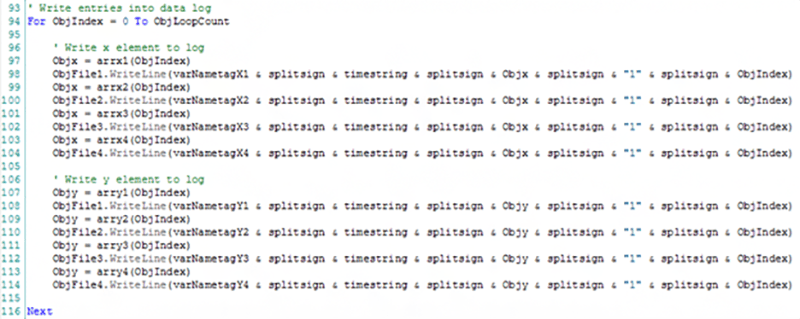
Next, we get to add all of our data.
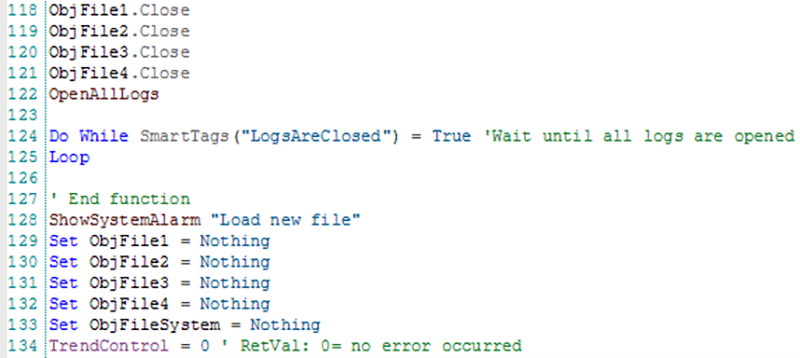
The last bit of our script opens the logs and ends the function.
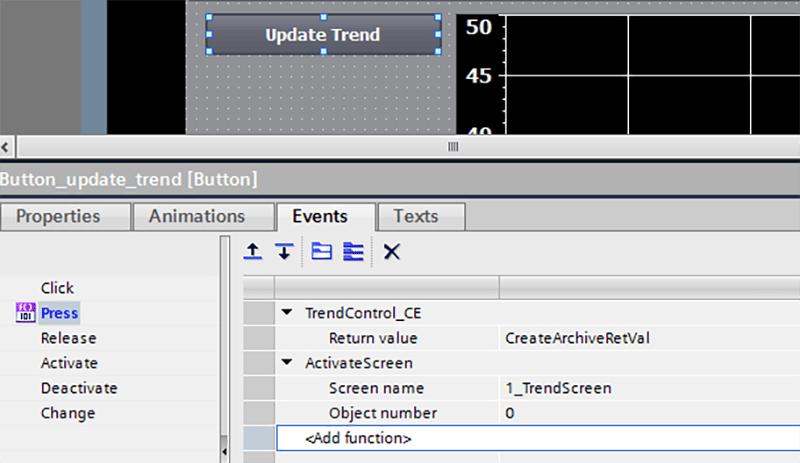
Finally, I created a button on the graph screen to call our script. The return value is populated if any errors occurred during our script execution. The button also re-loads the screen to ensure the trend refreshes with the new values.
In summary, the following internal HMI tags are used in this demonstration:
Step 3: Configure Historical Data
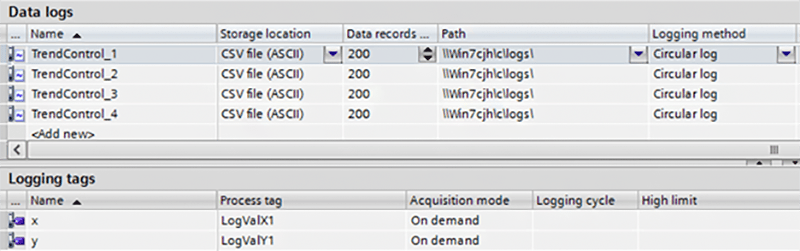
Now we need to set up our data logs and logging tags under the “Historical data” section of our HMI project. These log names and process tags match what I am using in my script.
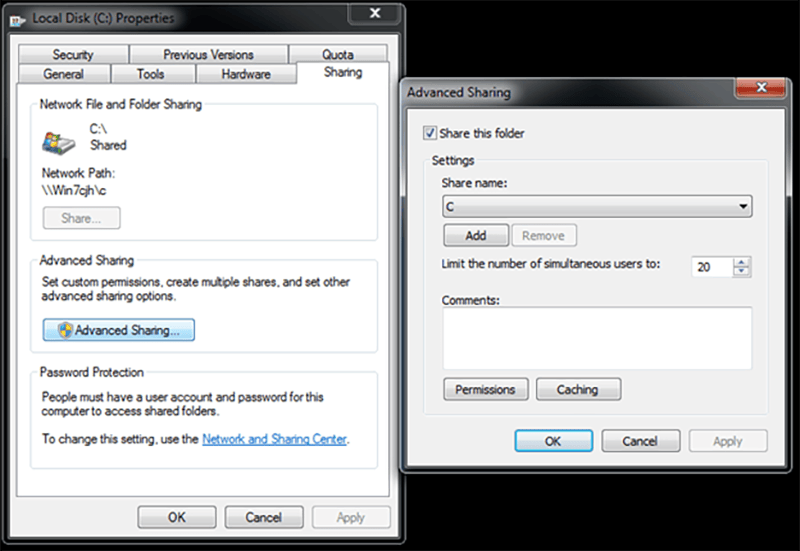
For the path, since I am simulating this project on my computer, I used my C: drive. To do this, I had to ensure that my folder sharing permissions were set to allow sharing.
Step 4: Configure Trend View
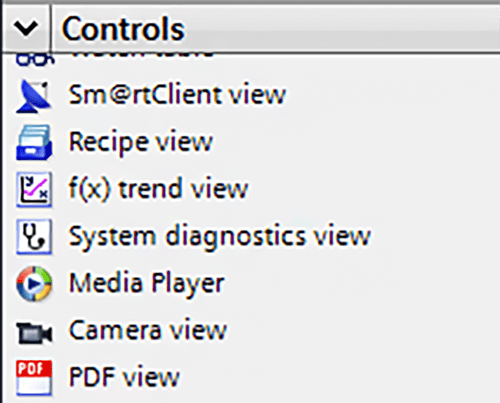
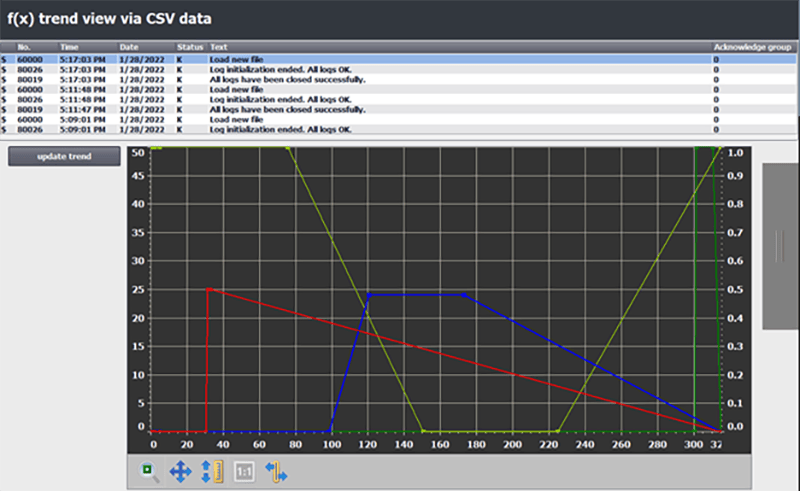
On my trend screen, I created an f(x) trend view.
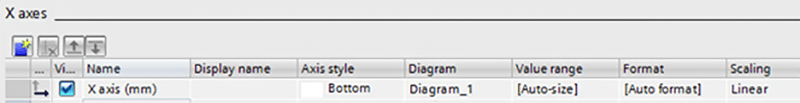
For my project, I have a single X axis with units in millimeters.
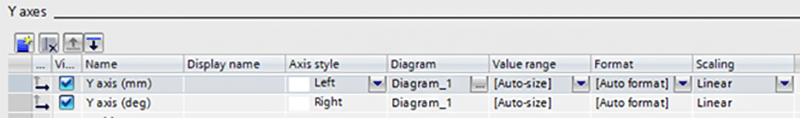
I created two Y axes for displaying trends in both millimeters and degrees.
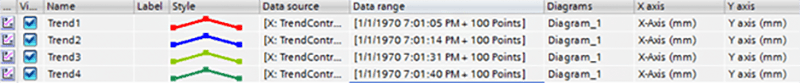
Last but not least, I created all four trends. The data sources are linked to each data log I set up in the previous step (Configuring Historical Data). During testing, there was some inconsistent behavior with the trend depending on how the date range was configured. This was due to the timestamps in the CSV. The most consistent setup we found was to set the date range as shown below: starting at 1/1/1970.
Step 5: Simulate & Test
Since this project only uses tags that are internal to the HMI, I was able to simulate and test the HMI by itself. I randomly generated some values to put in my input table, and then I navigated to my chart view and ran my script by pressing the “update trend” button.
Step 6: Changes for Windows CE
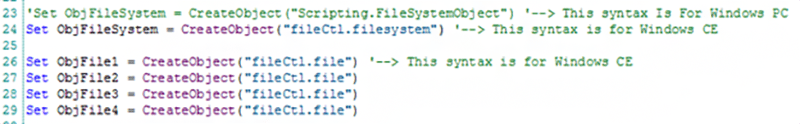
Steps one to five work great for creating a standalone project that can be simulated on a Windows PC; however, Windows CE and Windows PC have some different syntax in VBScript when it comes to handling the file system.
First of all, creating the files and instantiating the file system look slightly different (see below for a comparison). In this version of my script, the Windows PC syntax has been commented out and the Windows CE version is active.
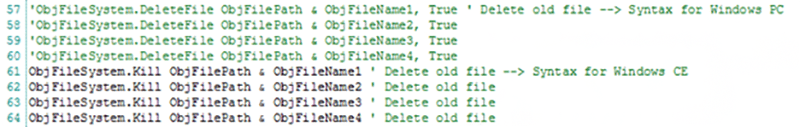
Likewise, deleting our files requires a slightly different file system command.
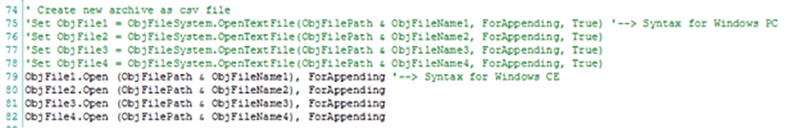
Setting up our archives uses a different command as well.
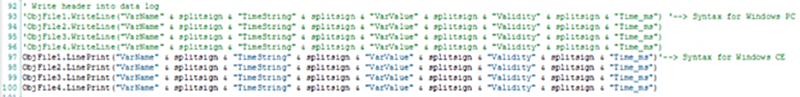
See the image below for differences in how to create a header for the data log.
Last of all, adding data to the file also uses a different system command.

Conclusion
This use of data logging and trend views is pretty nifty! Our client was especially grateful for the ability to visualize cam profiles before running them on their machine. I hope this blog helped to clarify some of the steps in the process. I look forward to finding more creative ways to utilize this script in the future.
Learn more about DMC’s Siemens expertise and contact us for your next project.