If you use Inductive Automation's Ignition server software designed for total system integration, you might encounter instances when your script doesn’t run correctly the first time.
Here are a few tools to help you find the bug.
Tool One - Gateway Script
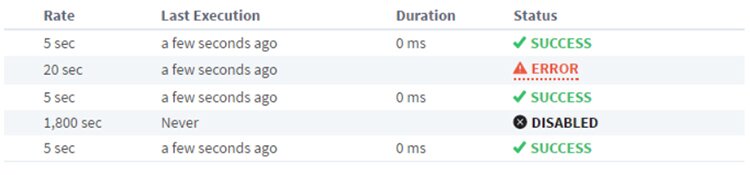
If you're running a gateway script, the first place you should navigate to is the Status Page of the gateway.
Then, locate the Gateway Scripts page.
There, you will be able to see a list of all the gateways scripts along with their status. If the status is Error, you can click on it to get more information about why the script is failing.
Tool Two - Script Console
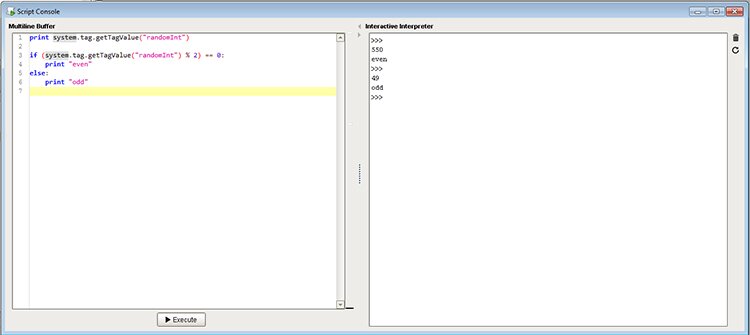
Another great debugging tool is the Script Console.
To access this, navigate to tools – script console. You can insert code into the multiline buffer and press execute. This writes the output of the script directly to the interactive interpreter right next to it.
Tool Three - Print Function
Finally, the last great script debugging tool is the Print Function. You can use the print function in Python scripts that are called in the gateway or the local client. In your script simply put print('Debug string') and it will print out that debug string.
If you are using “print” as part of a gateway script, it will print to a log file located in C:\Program Files\Inductive Automation\Ignition\logs.
If the script is run through the local client you can use the Output console to view the print statement. You can access it through Tools – Console.
For more on Ignition, check out these 4 Tips for Ignition Designer.
Learn more about DMC's PLC Programming services.